Open in Colab: https://colab.research.google.com/github/casangi/cngi_prototype/blob/master/docs/verification.ipynb
CASA Mapping
CASA today has a complex interface that intertwines many use cases and target audiences, including interactive users and automated pipelines. The primary interface for most is the CASA task list. CASA tasks themselves range from simple functions to complex applications and are meant for a wide variety of purposes.
Here we map the current CASA task list to where the equivalent functionality will (eventually) live in the next generation software. In some cases this is not a one to one mapping, as tasks may be split in to multiple functions, or multiple tasks may be handled by a single function.
The future design thinking is to separate functionality into CNGI, ngCASA, and Application layers. The primary focus of this demonstration package is the CNGI layer, containing core mathematics and operations directly on datastructures themselves. Some preliminary ngCASA level design and prototyping work exists to build confidence that the CNGI level will suffice for next generation science performance. Very little application layer work has been done to date, but this will (eventually) be the layer that most users interact with, and tailored to specific use cases. Refer to the Introduction section for more information.
Tasks marked with N/A or “direct on xarray dataset” are no longer needed due to fundamental changes in data storage and access in CNGI.
accor - ngCASA TBD
apparentsens - ngCASA TBD
applycal - ngCASA TBD
asdmsummary - cngi.conversion TBD
bandpass - ngCASA TBD
blcal - ngCASA TBD
browsetable - ng Application TBD
calstat - ngCASA TBD
clearcal - ngCASA TBD
clearstat - N/A
concat -
cngi.vis.join_visconjugatevis - cngi direct on xarray dataset
cvel - cngi.vis.regrid TBD
cvel2 - cngi.vis.regrid TBD
deconvolve - ngCASA TBD
delmod - N/A
exportasdm - cngi.conversion.save_asdm TBD
exportfits - cngi.conversion.save_image TBD
exportuvfits - cngi.conversion.save_ms TBD
feather - ngCASA TBD
fixplanets - ngCASA TBD
fixvis - cngi.vis.phase_shift TBD
flagcmd - ngCASA TBD
flagdata - ngCASA TBD
flagmanager - ngCASA TBD
fluxscale - ngCASA TBD
fringefit - ngCASA TBD
ft - ngCASA TBD
gaincal - ngCASA TBD
gencal - ngCASA TBD
hanningsmooth -
cngi.vis.chan_smoothimcollapse - cngi direct on xarray dataset
imcontsub -
cngi.image.cont_subimdev -
cngi.image.statistics+ direct on xarray datasetimfit -
cngi.image.fit_gaussianimhead - cngi direct on xarray dataset
imhistory - cngi stored in xarray dataset attributes
immath - cngi direct on xarray dataset
immoments -
cngi.image.momentsimpbcor - ngCASA TBD
importasdm - cngi.conversion.convert_asdm
importatca - cngi.conversion TBD
importfits -
cngi.conversion.convert_imageimportfitsidi - cngi.conversion TBD
importgmrt - cngi.conversion TBD
importmiriad - cngi.conversion TBD
importuvfits - cngi.conversion.convert_ms
importvla - cngi.conversion TBD
impv - cngi.image.posvel TBD
imrebin -
cngi.image.rebinimreframe -
cngi.image.reframeimregrid - cngi.image.regrid TBD
imsmooth -
cngi.image.smoothimstat -
cngi.image.statisticsimsubimage - cngi direct on xarray dataset
imtrans - cngi direct on xarray dataset
imval - cngi direct on xarray dataset
imview - ng Application TBD
initweights - ngCASA TBD
listcal - cngi direct on xarray dataset
listfits - TBD
listhistory - cngi stored in xarray dataset attributes
listobs - cngi direct on xarray dataset
listpartition - N/A
listsdm - cngi direct on xarray dataset
listvis - cngi direct on xarray dataset
makemask -
cngi.image.maskmstransform -
cngi.vis.join_vis,cngi.vis.chan_average, cngi.vis.regrid TBD,cngi.vis.time_averagemsuvbin - ngCASA TBD
msview - ng Application TBD
nrobeamaverage - ngCASA TBD
partition - N/A
plotants - ng Application TBD
plotbandpass - ng Application TBD
plotcal - ng Application TBD
plotms - ng Application TBD
plotprofilemap - ng Application TBD
plotweather - ng Application TBD
polcal - ngCASA TBD
polfromgain - ngCASA TBD
predictcomp - ngCASA TBD
rerefant - ngCASA TBD
rmfit - cngi.image.rmfit TBD
rmtables - N/A
sdbaseline - cngi.vis.sd_fit TBD + direct on xarray dataset
sdcal - ngCASA TBD
sdfit - cngi.vis.sdfit TBD
sdfixscan - cngi.image.sd_fix_scan TBD
sdgaincal - ngCASA TBD
sdimaging - ngCASA TBD
sdintimaging - ng Application TBD
sdpolaverage - cngi.vis.sd_pol_average TBD
sdsidebandsplit - ngCASA TBD
sdsmooth -
cngi.vis.chan_smoothsdtimeaverage -
cngi.vis.time_averagesetjy - ngCASA TBD
simalma - ng Application TBD
simanalyze - ng Application TBD
simobserve - ng Application TBD
slsearch - cngi.external TBD
smoothcal - ngCASA TBD
specfit -
cngi.image.spec_fitspecflux - cngi.image.spec_flux TBD
specsmooth - cngi.image.spec_smooth TBD
splattotable - cngi.external TBD
split -
cngi.vis.chan_average,cngi.vis.time_average+cngi.vis.split_datasetspxfit - cngi.image.spx_fit TBD
statwt - ngCASA TBD
tclean - ng Application TBD
tsdimaging - ng Application TBD
uvcontsub -
cngi.uv_cont_fituvmodelfit - cngi.uv_model_fit TBD
uvsub - cngi direct on xarray dataset
viewer - CARTA
virtualconcat - N/A
vishead - cngi direct on xarray dataset
visstat - cngi direct on xarray dataset
widebandpbcor - ngCASA TBD
wvrgcal - ngCASA TBD
In the following sections we demonstrate how current CASA tasks may be satisfied in the new mapping to CNGI capabilities.
Note: This is a concept demonstration only and not meant to verify scientific accuracy
This section like most others may be run by readers in Google Colab using the provided link in the header. The first step in exdecution is to install necessary components and generate data to be used in the demonstration comparison to CASA6
[1]:
import os, warnings
warnings.simplefilter("ignore", category=RuntimeWarning)  # suppress warnings about nan-slices
print("installing casa6 and cngi (takes a few minutes)...")
os.system("apt-get install libgfortran3")
os.system("pip install casatasks==6.3.0.48")
os.system("pip install casadata")
os.system("pip install cngi-prototype==0.0.92")

print("downloading MeasurementSet from CASAguide First Look at Imaging...")
!gdown -q --id 1N9QSs2Hbhi-BrEHx5PA54WigXt8GGgx1
!tar -xzf sis14_twhya_calibrated_flagged.ms.tar.gz
!mv sis14_twhya_calibrated_flagged.ms twhya.ms
print('converting ms...')
installing casa6 and cngi (takes a few minutes)...
downloading MeasurementSet from CASAguide First Look at Imaging...
converting ms...
[2]:
from casatasks import tclean
from cngi.conversion import convert_ms, convert_image
from cngi.image import implot
from cngi.vis import visplot
import numpy as np
import matplotlib.pyplot as plt

mxds = convert_ms('twhya.ms')

print("running tclean to generate an image")
tclean(vis='twhya.ms', imagename='twhya', field='5', spw='',
       specmode='cube', deconvolver='hogbom', nterms=1, imsize=[250,250], gridder='standard', cell=['0.1arcsec'],
       nchan=10, weighting='natural', threshold='0mJy', niter=100, interactive=False, savemodel='modelcolumn',
       usemask='auto-multithresh')

image_xds = convert_image('twhya.image')
mxds = convert_ms('twhya.ms')  # reconvert to get MODEL_DATA col
Completed ddi 0  process time 22.91 s
Completed subtables  process time 1.06 s

running tclean to generate an image
converting Image...
processed image in 1.3743491 seconds
Completed ddi 0  process time 26.86 s
Completed subtables  process time 1.10 s
cngi.vis Module
Demonstration of CASA functions to be handled by the CNGI visibility module.
Note: this is a demonstration of mechanics only and is not intended for science
listobs
Note the mechanism for retrieving data from the MeasurementSet is fundamentally different, but the data itself is the same
[3]:
# CASA 6
from casatasks import listobs

listobs(vis='twhya.ms', listfile='obslist.txt', verbose=False, overwrite=True)
!cat obslist.txt
================================================================================
           MeasurementSet Name:  /content/twhya.ms      MS Version 2
================================================================================
   Observer: cqi     Project: uid://A002/X327408/X6f
Observation: ALMA(26 antennas)
Data records: 80563       Total elapsed time = 5647.68 seconds
   Observed from   19-Nov-2012/07:36:57.0   to   19-Nov-2012/09:11:04.7 (UTC)

Fields: 5
  ID   Code Name                RA               Decl           Epoch   SrcId      nRows
  0    none J0522-364           05:22:57.984648 -36.27.30.85128 J2000   0           4200
  2    none Ceres               06:10:15.950590 +23.22.06.90668 J2000   2           3800
  3    none J1037-295           10:37:16.079736 -29.34.02.81316 J2000   3          16000
  5    none TW Hya              11:01:51.796000 -34.42.17.36600 J2000   4          53161
  6    none 3c279               12:56:11.166576 -05.47.21.52464 J2000   5           3402
Spectral Windows:  (1 unique spectral windows and 1 unique polarization setups)
  SpwID  Name                           #Chans   Frame   Ch0(MHz)  ChanWid(kHz)  TotBW(kHz) CtrFreq(MHz) BBC Num  Corrs
  0      ALMA_RB_07#BB_2#SW-01#FULL_RES    384   TOPO  372533.086       610.352    234375.0 372649.9688        2  XX  YY
Antennas: 21 'name'='station'
   ID=   1-4: 'DA42'='A050', 'DA44'='A068', 'DA45'='A070', 'DA46'='A067',
   ID=   5-9: 'DA48'='A046', 'DA49'='A029', 'DA50'='A045', 'DV02'='A077',
   ID= 10-15: 'DV05'='A082', 'DV06'='A037', 'DV08'='A021', 'DV10'='A071',
   ID= 16-19: 'DV13'='A072', 'DV15'='A074', 'DV16'='A069', 'DV17'='A138',
   ID= 20-24: 'DV18'='A053', 'DV19'='A008', 'DV20'='A020', 'DV22'='A011',
   ID= 25-25: 'DV23'='A007'
[4]:
# CNGI
#print('Observation ', mxds.OBSERVATION.compute().data_vars)
#print('Field ', mxds.FIELD.compute().data_vars)
#print('Spectral Window ', mxds.SPECTRAL_WINDOW.compute().data_vars)
#print('Source ', mxds.SOURCE.compute().data_vars)
#print('Antenna ', mxds.ANTENNA.compute().data_vars)
print(mxds.dims)
print(mxds.coords)
Frozen(SortedKeysDict({'antenna_ids': 26, 'field_ids': 7, 'feed_ids': 26, 'observation_ids': 1, 'polarization_ids': 1, 'source_ids': 5, 'spw_ids': 1, 'state_ids': 20}))
Coordinates:
  * antenna_ids       (antenna_ids) int64 0 1 2 3 4 5 6 ... 19 20 21 22 23 24 25
    antennas          (antenna_ids) <U16 'DA41' 'DA42' 'DA44' ... 'DV22' 'DV23'
  * field_ids         (field_ids) int64 0 1 2 3 4 5 6
    fields            (field_ids) <U9 'J0522-364' 'J0539+145' ... '3c279'
  * feed_ids          (feed_ids) int64 0 0 0 0 0 0 0 0 0 0 ... 0 0 0 0 0 0 0 0 0
  * observation_ids   (observation_ids) int64 0
    observations      (observation_ids) <U23 'uid://A002/X327408/X6f'
  * polarization_ids  (polarization_ids) int64 0
  * source_ids        (source_ids) int64 0 1 2 3 4
    sources           (source_ids) <U9 'J0522-364' 'Ceres' ... 'TW Hya' '3c279'
  * spw_ids           (spw_ids) int64 0
  * state_ids         (state_ids) int64 0 1 2 3 4 5 6 7 ... 13 14 15 16 17 18 19
listvis
Note the mechanism for retrieving data from the MeasurementSet is fundamentally different, but the data itself is the same
[5]:
# CASA 6
from casatasks import listvis

os.system("rm -fr vislist.txt")
listvis(vis='twhya.ms', field="J1037-295", timerange='<07:53:00', antenna='DA46',
        spw='*:30~40', datacolumn='data', listfile='vislist.txt')
!tail -n 18 vislist.txt
Units of columns are: Date/Time(YYMMDD/HH:MM:SS UT), UVDist(wavelength), Phase(deg), UVW(m)
FIELD: 3
SPW: 0
Date/Time:                           XX:                  YY:
2012/11/19/      Intrf UVDist  Chn     Amp     Phs  Wt F    Amp     Phs  Wt F         U         V         W
------------|---------|------|----|---------------------|--------------------|---------|---------|---------|
  07:52:57.2 DA46-DV23  65292   30: 14.690   -18.7   9    6.279    40.7  17       44.17     28.46     43.89
  07:52:57.2 DA46-DV23  65292   31:  1.951    62.0   9    1.091   132.5  17       44.17     28.46     43.89
  07:52:57.2 DA46-DV23  65292   32: 12.303    -5.4   9    1.837    83.7  17       44.17     28.46     43.89
  07:52:57.2 DA46-DV23  65292   33: 32.372   -63.7   9    9.889   -18.0  17       44.17     28.46     43.89
  07:52:57.2 DA46-DV23  65292   34: 13.741    61.8   9   19.342   -45.3  17       44.17     28.46     43.89
  07:52:57.2 DA46-DV23  65292   35: 14.456   109.7   9   10.931   -75.3  17       44.17     28.46     43.89
  07:52:57.2 DA46-DV23  65292   36: 10.487     4.9   9   11.387   -79.9  17       44.17     28.46     43.89
  07:52:57.2 DA46-DV23  65292   37:  9.204  -136.4   9    5.963  -166.3  17       44.17     28.46     43.89
  07:52:57.2 DA46-DV23  65292   38: 33.276     1.9   9    4.406    67.3  17       44.17     28.46     43.89
  07:52:57.2 DA46-DV23  65292   39: 16.079   108.8   9    8.067   172.0  17       44.17     28.46     43.89
  07:52:57.2 DA46-DV23  65292   40: 16.795   -20.8   9    9.997    96.8  17       44.17     28.46     43.89
------------|---------|------|----|---------------------|--------------------|---------|---------|---------|
[6]:
# CNGI
field_id = mxds.field_ids[np.where(mxds.fields == "J1037-295")][0]
selection = mxds.xds0.isel(chan=range(30,40)).sel(time='2012-11-19T07:52').where(mxds.xds0.FIELD_ID == field_id, drop=True).compute()
print(selection)
<xarray.Dataset>
Dimensions:         (baseline: 190, chan: 10, pol: 2, pol_id: 1, spw_id: 1, time: 3, uvw_index: 3)
Coordinates:
  * time            (time) datetime64[ns] 2012-11-19T07:52:45.072000504 ... 2...
  * baseline        (baseline) int64 0 1 2 3 4 5 6 ... 201 202 203 207 208 209
  * chan            (chan) float64 3.726e+11 3.726e+11 ... 3.726e+11 3.726e+11
    chan_width      (chan) float64 6.104e+05 6.104e+05 ... 6.104e+05 6.104e+05
    effective_bw    (chan) float64 6.104e+05 6.104e+05 ... 6.104e+05 6.104e+05
  * pol             (pol) int64 9 12
  * pol_id          (pol_id) int64 0
    resolution      (chan) float64 6.104e+05 6.104e+05 ... 6.104e+05 6.104e+05
  * spw_id          (spw_id) int64 0
    field_ids       int64 3
    fields          <U9 'J1037-295'
Dimensions without coordinates: uvw_index
Data variables: (12/18)
    ANTENNA1        (baseline, time) float64 1.0 1.0 1.0 1.0 ... 24.0 24.0 24.0
    ANTENNA2        (baseline, time) float64 2.0 2.0 2.0 3.0 ... 25.0 25.0 25.0
    ARRAY_ID        (time, baseline) float64 0.0 0.0 0.0 0.0 ... 0.0 0.0 0.0 0.0
    DATA            (time, baseline, chan, pol) complex128 (-2.60023474693298...
    DATA_WEIGHT     (time, baseline, chan, pol) float64 12.39 21.67 ... 14.35
    EXPOSURE        (time, baseline) float64 6.048 6.048 6.048 ... 6.048 6.048
    ...              ...
    OBSERVATION_ID  (time, baseline) float64 0.0 0.0 0.0 0.0 ... 0.0 0.0 0.0 0.0
    PROCESSOR_ID    (time, baseline) float64 2.0 2.0 2.0 2.0 ... 2.0 2.0 2.0 2.0
    SCAN_NUMBER     (time, baseline) float64 10.0 10.0 10.0 ... 10.0 10.0 10.0
    STATE_ID        (time, baseline) float64 8.0 8.0 8.0 8.0 ... 8.0 8.0 8.0 8.0
    TIME_CENTROID   (time, baseline) float64 4.86e+09 4.86e+09 ... 4.86e+09
    UVW             (time, baseline, uvw_index) float64 115.4 -56.68 ... 22.89
Attributes: (12/14)
    assoc_nature:     ['', '', '', '', '', '', '', '', '', '', '', '', '', ''...
    bbc_no:           2
    corr_product:     [[0, 0], [1, 1]]
    data_groups:      [{'0': {'data': 'DATA', 'flag': 'FLAG', 'id': '0', 'uvw...
    freq_group:       0
    freq_group_name:
    ...               ...
    name:             ALMA_RB_07#BB_2#SW-01#FULL_RES
    net_sideband:     2
    num_chan:         384
    num_corr:         2
    ref_frequency:    372533086425.9812
    total_bandwidth:  234375000.0
concat
[7]:
# CASA 6
from casatasks import concat, split

# first we need to create two ms's, then concat them
split('twhya.ms', 'ms1.ms', field='J0522-364', datacolumn='DATA')
split('twhya.ms', 'ms2.ms', field='Ceres', datacolumn='DATA')
concat(['ms1.ms', 'ms2.ms'], 'concatms.ms')
listobs(vis='concatms.ms', listfile='obslist.txt', verbose=False, overwrite=True)
!cat obslist.txt
================================================================================
           MeasurementSet Name:  /content/concatms.ms      MS Version 2
================================================================================
   Observer: cqi     Project: uid://A002/X327408/X6f
Observation: ALMA(26 antennas)
Data records: 8000       Total elapsed time = 604.272 seconds
   Observed from   19-Nov-2012/07:36:57.0   to   19-Nov-2012/07:47:01.2 (UTC)

Fields: 2
  ID   Code Name                RA               Decl           Epoch   SrcId      nRows
  0    none J0522-364           05:22:57.984648 -36.27.30.85128 J2000   0           4200
  1    none Ceres               06:10:15.950590 +23.22.06.90668 J2000   1           3800
Spectral Windows:  (1 unique spectral windows and 1 unique polarization setups)
  SpwID  Name                           #Chans   Frame   Ch0(MHz)  ChanWid(kHz)  TotBW(kHz) CtrFreq(MHz) BBC Num  Corrs
  0      ALMA_RB_07#BB_2#SW-01#FULL_RES    384   TOPO  372533.086       610.352    234375.0 372649.9688        2  XX  YY
Antennas: 21 'name'='station'
   ID=   1-4: 'DA42'='A050', 'DA44'='A068', 'DA45'='A070', 'DA46'='A067',
   ID=   5-9: 'DA48'='A046', 'DA49'='A029', 'DA50'='A045', 'DV02'='A077',
   ID= 10-15: 'DV05'='A082', 'DV06'='A037', 'DV08'='A021', 'DV10'='A071',
   ID= 16-19: 'DV13'='A072', 'DV15'='A074', 'DV16'='A069', 'DV17'='A138',
   ID= 20-24: 'DV18'='A053', 'DV19'='A008', 'DV20'='A020', 'DV22'='A011',
   ID= 25-25: 'DV23'='A007'
[8]:
# CNGI
from cngi.vis import join_dataset

mxds1 = convert_ms('ms1.ms')
mxds2 = convert_ms('ms2.ms')
jmxds = join_dataset(mxds1, mxds2)

print(jmxds.dims)
print(jmxds.coords)
Completed ddi 0  process time 1.64 s
Completed subtables  process time 1.06 s

Completed ddi 0  process time 1.61 s
Completed subtables  process time 1.07 s

Warning: reference value -1 in subtable WEATHER does not exist in ANTENNA.antenna_id!
Frozen(SortedKeysDict({'antenna_ids': 26, 'field_ids': 2, 'feed_ids': 26, 'observation_ids': 1, 'polarization_ids': 1, 'source_ids': 2, 'spw_ids': 1, 'state_ids': 20}))
Coordinates:
  * antenna_ids       (antenna_ids) int64 0 1 2 3 4 5 6 ... 19 20 21 22 23 24 25
    antennas          (antenna_ids) <U16 'DA41' 'DA42' 'DA44' ... 'DV22' 'DV23'
  * field_ids         (field_ids) int64 0 1
    fields            (field_ids) object 'J0522-364' 'Ceres'
  * feed_ids          (feed_ids) int64 0 0 0 0 0 0 0 0 0 0 ... 0 0 0 0 0 0 0 0 0
  * observation_ids   (observation_ids) int64 0
    observations      (observation_ids) <U23 'uid://A002/X327408/X6f'
  * polarization_ids  (polarization_ids) int64 0
  * source_ids        (source_ids) int64 0 1
    sources           (source_ids) object 'J0522-364' 'J1037-295'
  * spw_ids           (spw_ids) int64 0
  * state_ids         (state_ids) int64 0 1 2 3 4 5 6 7 ... 13 14 15 16 17 18 19
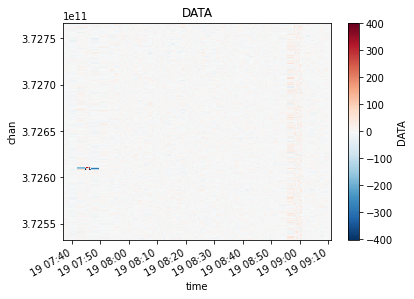
conjugatevis
[9]:
# CASA 6
from casatasks import conjugatevis

conjugatevis(vis='twhya.ms', outputvis='casa6.conj.ms', overwrite=True)

casa_xds = convert_ms('casa6.conj.ms').xds0
visplot(casa_xds.DATA.imag[:,100,:,0], axis=['time','chan'])
Completed ddi 0  process time 27.06 s
Completed subtables  process time 1.10 s

[10]:
# CNGI
cngi_xda = mxds.xds0.DATA.conj()

visplot(cngi_xda.imag[:,100,:,0], axis=['time','chan'])
[11]:
# Delta
print('max delta : ', np.nanmax(np.abs((casa_xds.DATA - cngi_xda).values)))
max delta : 0.0
hanningsmooth
[12]:
# CASA6
from casatasks import hanningsmooth

hanningsmooth(vis='twhya.ms', outputvis='casa6.smooth.ms', datacolumn='data')

casa_xds = convert_ms('casa6.smooth.ms').xds0
visplot(casa_xds.DATA, axis='chan')
Completed ddi 0  process time 22.05 s
Completed subtables  process time 1.06 s
[13]:
# CNGI
from cngi.vis import apply_flags, chan_smooth

cngi_xds = chan_smooth(mxds, 'xds0').xds0

visplot(cngi_xds.DATA, axis='chan')
[14]:
# Delta
print('max delta : ', np.nanmax(np.abs((casa_xds.DATA - cngi_xds.DATA).values)))
max delta : 6.104260637590507e-05
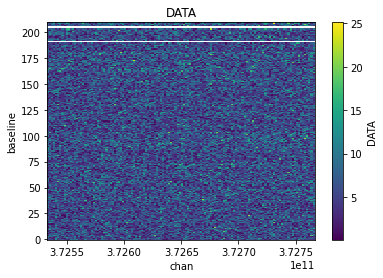
mstransform
chanaverage
[15]:
# CASA 6
from casatasks import mstransform

os.system("rm -fr casa6.avg.ms")
mstransform(vis='twhya.ms', outputvis='casa6.avg.ms', datacolumn='DATA', chanaverage=True, chanbin=3)

casa_xds = convert_ms('casa6.avg.ms').xds0
visplot(casa_xds.DATA[100,:,:,0], axis=['chan', 'baseline'])
Completed ddi 0  process time 8.50 s
Completed subtables  process time 1.04 s
[16]:
# CNGI
from cngi.vis import chan_average

cngi_xds = chan_average(mxds, 'xds0', width=3).xds0

visplot(cngi_xds.DATA[100,:,:,0], axis=['chan', 'baseline'])
[17]:
# Delta
print('max delta : ', np.nanmax(np.abs((casa_xds.DATA[100,:,:,0] - cngi_xds.DATA[100,:,:,0]).values)))
max delta : 1.5973847098419519e-06
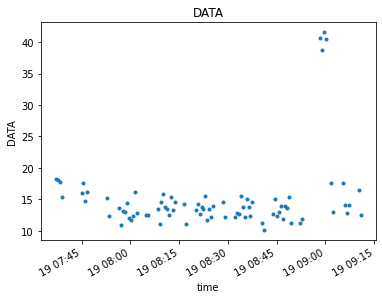
timeaverage
[18]:
# CASA 6
from casatasks import mstransform

os.system("rm -fr casa6.tavg.ms")
mstransform(vis='twhya.ms', outputvis='casa6.tavg.ms', datacolumn='DATA', timeaverage=True, timebin='25s', timespan='state')

casa_xds = convert_ms('casa6.tavg.ms').xds0
visplot(casa_xds.DATA[:,:,100,0], axis='time')
Completed ddi 0  process time 4.47 s
Completed subtables  process time 1.04 s
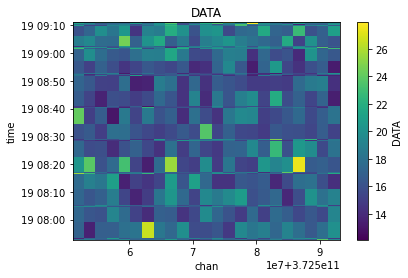
[19]:
# CNGI
from cngi.vis import time_average

mxds2 = mxds.assign_attrs({'xds1':mxds.xds0.chunk(400, 210, 64, 1)}) # increase chunk size to avoid warnings
cngi_xds = time_average(mxds2, 'xds1', bin=5, span='state').xds1

visplot(cngi_xds.DATA[:,:,100,0], axis='time')
[20]:
# Delta
print('max delta : ', np.nanmax(np.abs((casa_xds.DATA[:,:,100,0] - cngi_xds.DATA[:,:,100,0]).values)))
max delta : 5.173171442074411e-06
sdsmooth - TBD
likely to be demonstrated as satisfied by cngi.vis.chan_smooth
sdtimeaverage - TBD
likely to be demonstrated as satisfied by cngi.vis.time_average
split
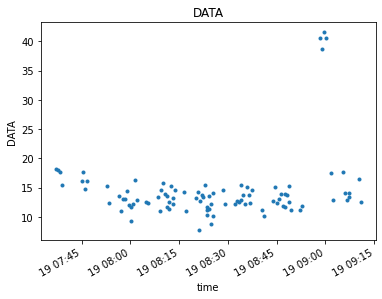
[21]:
# CASA 6
from casatasks import split

os.system("rm -fr casa6.split.ms")
split(vis='twhya.ms', outputvis='casa6.split.ms', datacolumn='DATA', spw='*:30~100', field='3', width=3)

casa_xds = convert_ms('casa6.split.ms').xds0
visplot(casa_xds.DATA, axis=['chan', 'time'])
Completed ddi 0  process time 0.81 s
Completed subtables  process time 1.06 s
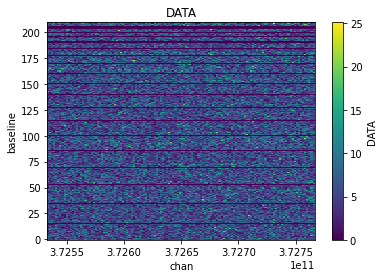
[22]:
# CNGI
from cngi.vis import chan_average

selection = mxds.xds0.isel(chan=range(30,101)).where(mxds.xds0.FIELD_ID == 3, drop=True)
cngi_xds = chan_average(mxds.assign_attrs({'xds1':selection}), 'xds1', width=3).xds1

visplot(cngi_xds.DATA, axis=['chan', 'time'])

[23]:
# Delta
print('max delta : ', np.nanmax(np.abs((casa_xds.DATA - cngi_xds.DATA).values)))
max delta : 2.132480599880018e-06
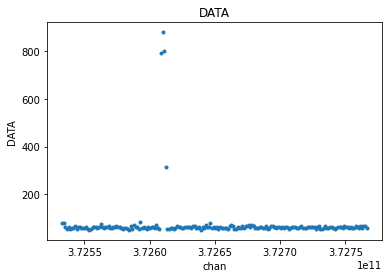
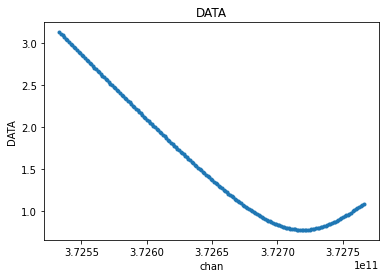
uvcontsub
[24]:
# CASA 6
from casatasks import uvcontsub

uvcontsub(vis='twhya.ms', field="5", combine='scan', fitspw='0:200~300', excludechans=True, fitorder=1, want_cont=True)

casa_cont_xds = convert_ms('twhya.ms.cont').xds0

visplot(casa_cont_xds.DATA[10,10,:,0], axis=['chan'])
Completed ddi 0  process time 12.90 s
Completed subtables  process time 1.31 s
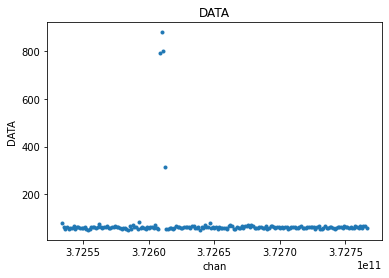
[25]:
# CNGI
from cngi.vis import uv_cont_fit

selection = mxds.xds0.where(mxds.xds0.FIELD_ID == 5, drop=True)
cngi_xds = uv_cont_fit(mxds.assign_attrs({'xds1':selection}), 'xds1', source='DATA', target='CONTFIT', fitorder=1, excludechans=list(range(200,300))).xds1

visplot(cngi_xds.CONTFIT[10,10,:,0], axis=['chan'])
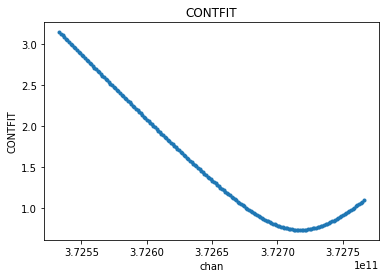
[26]:
# Delta
print('max delta : ', np.nanmax(np.abs((casa_cont_xds.DATA - cngi_xds.CONTFIT).values)))
max delta : 0.44718851662412784
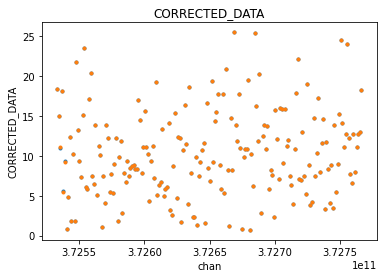
uvsub
[27]:
# CASA 6
from casatasks import uvsub

os.system('cp -r twhya.ms uvsub.ms')
uvsub('uvsub.ms')

casa_xds = convert_ms('uvsub.ms').xds0

visplot(casa_xds.DATA[310,10,:,0], axis=['chan'], drawplot=False)
visplot(casa_xds.CORRECTED_DATA[310,10,:,0], axis=['chan'], overplot=True)
Completed ddi 0  process time 48.04 s
Completed subtables  process time 1.20 s
[28]:
# CNGI
from cngi.vis import apply_flags

cngi_xda = mxds.xds0.DATA - mxds.xds0.MODEL_DATA

visplot(mxds.xds0.DATA[310,10,:,0], axis=['chan'], drawplot=False)
visplot(cngi_xda[310,10,:,0], axis=['chan'], overplot=True)
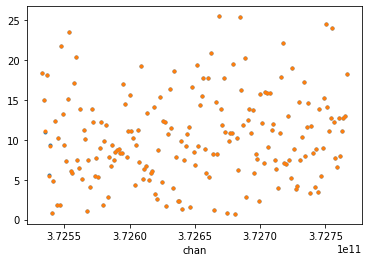
[29]:
# Delta
print('max delta : ', np.nanmax(np.abs((casa_xds.CORRECTED_DATA - cngi_xda).values)))
max delta : 3.0517578125e-05
vishead
Note the mechanism for retrieving data from the MeasurementSet is fundamentally different, but the data itself is the same
[30]:
# CASA 6
from casatasks import vishead

vishead(vis='twhya.ms', mode='list')
[30]:
{'field': (array(['J0522-364', 'J0539+145', 'Ceres', 'J1037-295', 'TW Hya', 'TW Hya',
         '3c279'], dtype='<U16'), {}),
 'freq_group_name': (array([''], dtype='<U16'), {}),
 'observer': (array(['cqi'], dtype='<U16'), {}),
 'project': (array(['uid://A002/X327408/X6f'], dtype='<U23'), {}),
 'release_date': (array([0.]),
  {'MEASINFO': {'Ref': 'UTC', 'type': 'epoch'},
   'QuantumUnits': array(['s'], dtype='<U16')}),
 'schedule': ({'r1': array([['SchedulingBlock uid://A002/X327408/X73'],
          ['ExecBlock uid://A002/X554543/X207']], dtype='<U39')}, {}),
 'schedule_type': (array(['ALMA'], dtype='<U16'), {}),
 'spw_name': (array(['ALMA_RB_07#BB_2#SW-01#FULL_RES'], dtype='<U31'), {}),
 'telescope': (array(['ALMA'], dtype='<U16'), {})}
[31]:
# CNGI
print(mxds)
<xarray.Dataset>
Dimensions:           (antenna_ids: 26, feed_ids: 26, field_ids: 7, observation_ids: 1, polarization_ids: 1, source_ids: 5, spw_ids: 1, state_ids: 20)
Coordinates:
  * antenna_ids       (antenna_ids) int64 0 1 2 3 4 5 6 ... 19 20 21 22 23 24 25
    antennas          (antenna_ids) <U16 'DA41' 'DA42' 'DA44' ... 'DV22' 'DV23'
  * field_ids         (field_ids) int64 0 1 2 3 4 5 6
    fields            (field_ids) <U9 'J0522-364' 'J0539+145' ... '3c279'
  * feed_ids          (feed_ids) int64 0 0 0 0 0 0 0 0 0 0 ... 0 0 0 0 0 0 0 0 0
  * observation_ids   (observation_ids) int64 0
    observations      (observation_ids) <U23 'uid://A002/X327408/X6f'
  * polarization_ids  (polarization_ids) int64 0
  * source_ids        (source_ids) int64 0 1 2 3 4
    sources           (source_ids) <U9 'J0522-364' 'Ceres' ... 'TW Hya' '3c279'
  * spw_ids           (spw_ids) int64 0
  * state_ids         (state_ids) int64 0 1 2 3 4 5 6 7 ... 13 14 15 16 17 18 19
Data variables:
    *empty*
Attributes: (12/17)
    xds0:             <xarray.Dataset>\nDimensions:         (baseline: 210, c...
    ANTENNA:          <xarray.Dataset>\nDimensions:        (antenna_id: 26, d...
    ASDM_ANTENNA:     <xarray.Dataset>\nDimensions:         (d0: 26, d1: 3)\n...
    ASDM_CALWVR:      <xarray.Dataset>\nDimensions:            (d0: 702, d1: ...
    ASDM_RECEIVER:    <xarray.Dataset>\nDimensions:           (d0: 26, d1: 2,...
    ASDM_STATION:     <xarray.Dataset>\nDimensions:    (d0: 28, d1: 3)\nDimen...
    ...               ...
    POLARIZATION:     <xarray.Dataset>\nDimensions:       (d0: 1, d1: 2, d2: ...
    PROCESSOR:        <xarray.Dataset>\nDimensions:   (d0: 3)\nCoordinates:\n...
    SOURCE:           <xarray.Dataset>\nDimensions:             (d0: 5, d1: 2...
    SPECTRAL_WINDOW:  <xarray.Dataset>\nDimensions:             (d1: 384, d2:...
    STATE:            <xarray.Dataset>\nDimensions:   (state_id: 20)\nCoordin...
    WEATHER:          <xarray.Dataset>\nDimensions:                 (d0: 385,...
visstat
[32]:
# CASA 6
from casatasks import visstat

casa_dict = visstat(vis='twhya.ms', axis='real', datacolumn='data')['DATA_DESC_ID=0']
print(casa_dict['max'], casa_dict['stddev'])
106.0803451538086 8.556056451642778
[33]:
# CNGI
from cngi.vis import apply_flags

cngi_max = apply_flags(mxds, 'xds0').xds0.DATA.real.max().values
cngi_std = apply_flags(mxds, 'xds0').xds0.DATA.real.std().values

print(cngi_max, cngi_std)
106.0803451538086 8.556056382448858
[34]:
# Delta
print('max delta : ', np.max(np.abs([casa_dict['max'] - cngi_max, casa_dict['stddev'] - cngi_std])))
max delta : 6.919391992710189e-08
cngi.image Module
Demonstration of CASA functions to be handled by the CNGI image module.
Note: this is a demonstration of mechanics only and is not intended for science
imhead
Note the mechanism for retrieving data from the image is fundamentally different, but the data itself is the same
[35]:
# CASA6
from casatasks import imhead

casa_dict = imhead(imagename='twhya.image', mode='summary')
casa_dict
[35]:
{'axisnames': array(['Right Ascension', 'Declination', 'Stokes', 'Frequency'],
       dtype='<U16'),
 'axisunits': array(['rad', 'rad', '', 'Hz'], dtype='<U16'),
 'defaultmask': 'mask0',
 'hasmask': True,
 'imagetype': 'Intensity',
 'incr': array([-4.84813681e-07,  4.84813681e-07,  1.00000000e+00,  6.10330159e+05]),
 'masks': array(['mask0'], dtype='<U16'),
 'messages': array([], dtype='<U16'),
 'ndim': 4,
 'perplanebeams': {'beams': {'*0': {'*0': {'major': {'unit': 'arcsec',
      'value': 0.6526992917060852},
     'minor': {'unit': 'arcsec', 'value': 0.5043594837188721},
     'positionangle': {'unit': 'deg', 'value': -65.8895263671875}}},
   '*1': {'*0': {'major': {'unit': 'arcsec', 'value': 0.6526992917060852},
     'minor': {'unit': 'arcsec', 'value': 0.5043594837188721},
     'positionangle': {'unit': 'deg', 'value': -65.8895263671875}}},
   '*2': {'*0': {'major': {'unit': 'arcsec', 'value': 0.652698278427124},
     'minor': {'unit': 'arcsec', 'value': 0.50435870885849},
     'positionangle': {'unit': 'deg', 'value': -65.88955688476562}}},
   '*3': {'*0': {'major': {'unit': 'arcsec', 'value': 0.6526971459388733},
     'minor': {'unit': 'arcsec', 'value': 0.5043579339981079},
     'positionangle': {'unit': 'deg', 'value': -65.88956451416016}}},
   '*4': {'*0': {'major': {'unit': 'arcsec', 'value': 0.6526962518692017},
     'minor': {'unit': 'arcsec', 'value': 0.5043571591377258},
     'positionangle': {'unit': 'deg', 'value': -65.88956451416016}}},
   '*5': {'*0': {'major': {'unit': 'arcsec', 'value': 0.6526952385902405},
     'minor': {'unit': 'arcsec', 'value': 0.5043563842773438},
     'positionangle': {'unit': 'deg', 'value': -65.88957977294922}}},
   '*6': {'*0': {'major': {'unit': 'arcsec', 'value': 0.6526942849159241},
     'minor': {'unit': 'arcsec', 'value': 0.5043556690216064},
     'positionangle': {'unit': 'deg', 'value': -65.88958740234375}}},
   '*7': {'*0': {'major': {'unit': 'arcsec', 'value': 0.6526930928230286},
     'minor': {'unit': 'arcsec', 'value': 0.5043548941612244},
     'positionangle': {'unit': 'deg', 'value': -65.88959503173828}}},
   '*8': {'*0': {'major': {'unit': 'arcsec', 'value': 0.6526919603347778},
     'minor': {'unit': 'arcsec', 'value': 0.5043540000915527},
     'positionangle': {'unit': 'deg', 'value': -65.88961029052734}}},
   '*9': {'*0': {'major': {'unit': 'arcsec', 'value': 0.6526909470558167},
     'minor': {'unit': 'arcsec', 'value': 0.5043532848358154},
     'positionangle': {'unit': 'deg', 'value': -65.88957214355469}}}},
  'nChannels': 10,
  'nStokes': 1},
 'refpix': array([125., 125.,   0.,   0.]),
 'refval': array([ 2.88792330e+00, -6.05713443e-01,  1.00000000e+00,  3.72520023e+11]),
 'shape': array([250, 250,   1,  10]),
 'tileshape': array([125,  50,   1,   5]),
 'unit': 'Jy/beam'}
[36]:
# CNGI
print(image_xds)
<xarray.Dataset>
Dimensions:          (chan: 10, l: 250, m: 250, pol: 1, time: 1)
Coordinates:
  * chan             (chan) float64 3.725e+11 3.725e+11 ... 3.725e+11 3.725e+11
    declination      (l, m) float64 dask.array<chunksize=(250, 250), meta=np.ndarray>
  * l                (l) float64 6.06e-05 6.012e-05 ... -5.963e-05 -6.012e-05
  * m                (m) float64 -6.06e-05 -6.012e-05 ... 5.963e-05 6.012e-05
  * pol              (pol) float64 1.0
    right_ascension  (l, m) float64 dask.array<chunksize=(250, 250), meta=np.ndarray>
  * time             (time) datetime64[ns] 2012-11-19T07:56:26.544000626
Data variables:
    AUTOMASK         (l, m, time, chan, pol) float64 dask.array<chunksize=(250, 250, 1, 1, 1), meta=np.ndarray>
    IMAGE            (l, m, time, chan, pol) float64 dask.array<chunksize=(250, 250, 1, 1, 1), meta=np.ndarray>
    IMAGE_MASK0      (l, m, time, chan, pol) bool dask.array<chunksize=(250, 250, 1, 1, 1), meta=np.ndarray>
    MODEL            (l, m, time, chan, pol) float64 dask.array<chunksize=(250, 250, 1, 1, 1), meta=np.ndarray>
    PB               (l, m, time, chan, pol) float64 dask.array<chunksize=(250, 250, 1, 1, 1), meta=np.ndarray>
    PB_MASK0         (l, m, time, chan, pol) bool dask.array<chunksize=(250, 250, 1, 1, 1), meta=np.ndarray>
    PSF              (l, m, time, chan, pol) float64 dask.array<chunksize=(250, 250, 1, 1, 1), meta=np.ndarray>
    RESIDUAL         (l, m, time, chan, pol) float64 dask.array<chunksize=(250, 250, 1, 1, 1), meta=np.ndarray>
    RESIDUAL_MASK0   (l, m, time, chan, pol) bool dask.array<chunksize=(250, 250, 1, 1, 1), meta=np.ndarray>
    SUMWT            (time, chan, pol) float64 dask.array<chunksize=(1, 1, 1), meta=np.ndarray>
Attributes: (12/19)
    axisnames:            ['Right Ascension', 'Declination', 'Time', 'Frequen...
    axisunits:            ['rad', 'rad', 'datetime64[ns]', 'Hz', '']
    commonbeam:           [0.6526992917060852, 0.5043594837188721, -65.889526...
    commonbeam_units:     ['arcsec', 'arcsec', 'deg']
    date_observation:     2012/11/19/07
    direction_reference:  j2000
    ...                   ...
    restoringbeam:        [0.6526992917060852, 0.5043594837188721, -65.889526...
    spectral__reference:  lsrk
    telescope:            alma
    telescope_position:   [2.22514e+06m, -5.44031e+06m, -2.48103e+06m] (itrf)
    unit:                 Jy/beam
    velocity__type:       radio
[37]:
# Delta
print('max delta : ', np.abs(casa_dict['incr'] - image_xds.incr).max())
max delta : 0.0
imval
Note the mechanism for retrieving data from the image is fundamentally different, but the data itself is the same
[38]:
# CASA6
from casatasks import imval

casa_dict = imval('twhya.image', box='85,100,86,102', chans='2')
casa_dict
[38]:
{'axes': [[0, 'Right Ascension'],
  [1, 'Declination'],
  [3, 'Frequency'],
  [2, 'Stokes']],
 'blc': [85, 100, 0, 2],
 'coords': array([[[ 2.88794689e+00, -6.05725563e-01,  1.00000000e+00,
           3.72521243e+11],
         [ 2.88794689e+00, -6.05725079e-01,  1.00000000e+00,
           3.72521243e+11],
         [ 2.88794689e+00, -6.05724594e-01,  1.00000000e+00,
           3.72521243e+11]],

        [[ 2.88794630e+00, -6.05725563e-01,  1.00000000e+00,
           3.72521243e+11],
         [ 2.88794630e+00, -6.05725079e-01,  1.00000000e+00,
           3.72521243e+11],
         [ 2.88794630e+00, -6.05724594e-01,  1.00000000e+00,
           3.72521243e+11]]]),
 'data': array([[0.01665862, 0.02118381, 0.02057032],
        [0.00525612, 0.00775176, 0.00969939]]),
 'mask': array([[ True,  True,  True],
        [ True,  True,  True]]),
 'trc': [86, 102, 0, 2],
 'unit': 'Jy/beam'}
[39]:
# CNGI
cngi_xds = image_xds.isel(l=range(85,87), m=range(100,103), chan=2).compute()
print(cngi_xds)
<xarray.Dataset>
Dimensions:          (l: 2, m: 3, pol: 1, time: 1)
Coordinates:
    chan             float64 3.725e+11
    declination      (l, m) float64 -0.6057 -0.6057 -0.6057 ... -0.6057 -0.6057
  * l                (l) float64 1.939e-05 1.891e-05
  * m                (m) float64 -1.212e-05 -1.164e-05 -1.115e-05
  * pol              (pol) float64 1.0
    right_ascension  (l, m) float64 2.888 2.888 2.888 2.888 2.888 2.888
  * time             (time) datetime64[ns] 2012-11-19T07:56:26.544000626
Data variables:
    AUTOMASK         (l, m, time, pol) float64 0.0 0.0 0.0 0.0 0.0 0.0
    IMAGE            (l, m, time, pol) float64 0.01666 0.02118 ... 0.009699
    IMAGE_MASK0      (l, m, time, pol) bool True True True True True True
    MODEL            (l, m, time, pol) float64 0.0 0.0 0.0 0.0 0.0 0.0
    PB               (l, m, time, pol) float64 0.8004 0.8046 ... 0.8115 0.8156
    PB_MASK0         (l, m, time, pol) bool True True True True True True
    PSF              (l, m, time, pol) float64 -0.01334 -0.01428 ... 0.0001316
    RESIDUAL         (l, m, time, pol) float64 0.01666 0.02118 ... 0.009699
    RESIDUAL_MASK0   (l, m, time, pol) bool True True True True True True
    SUMWT            (time, pol) float64 1.13e+07
Attributes: (12/19)
    axisnames:            ['Right Ascension', 'Declination', 'Time', 'Frequen...
    axisunits:            ['rad', 'rad', 'datetime64[ns]', 'Hz', '']
    commonbeam:           [0.6526992917060852, 0.5043594837188721, -65.889526...
    commonbeam_units:     ['arcsec', 'arcsec', 'deg']
    date_observation:     2012/11/19/07
    direction_reference:  j2000
    ...                   ...
    restoringbeam:        [0.6526992917060852, 0.5043594837188721, -65.889526...
    spectral__reference:  lsrk
    telescope:            alma
    telescope_position:   [2.22514e+06m, -5.44031e+06m, -2.48103e+06m] (itrf)
    unit:                 Jy/beam
    velocity__type:       radio
[40]:
# Delta
print('max delta : ', np.abs(casa_dict['data'] - cngi_xds.IMAGE.values.squeeze()).max())
max delta : 0.0
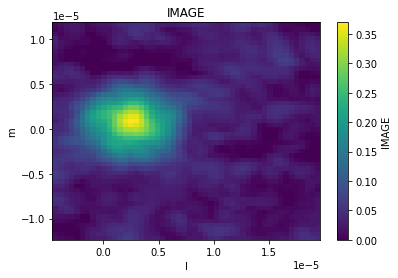
imcollapse
[41]:
# CASA6
from casatasks import imcollapse

imcollapse('twhya.image', function='sum', axes=[2,3], outfile='casa6.collapse.image', overwrite=True)

casa_xds = convert_image('casa6.collapse.image')
implot(casa_xds.IMAGE)
converting Image...
processed image in 0.21397114 seconds
[42]:
# CNGI
cngi_xds = image_xds.where(image_xds.IMAGE_MASK0).sum(dim=['chan','pol'])

implot(cngi_xds.IMAGE)

[43]:
# Delta
print('max delta : ', np.abs((casa_xds.IMAGE - cngi_xds.IMAGE).values).max())
max delta : 1.1920928955078125e-07
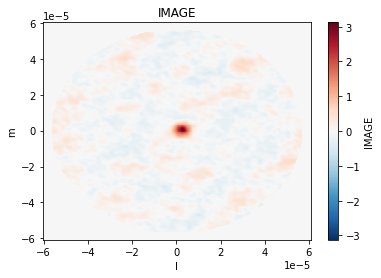
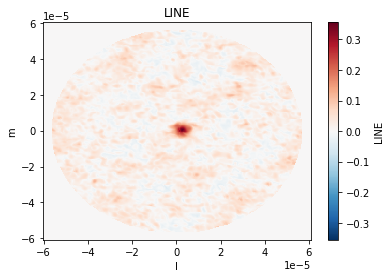
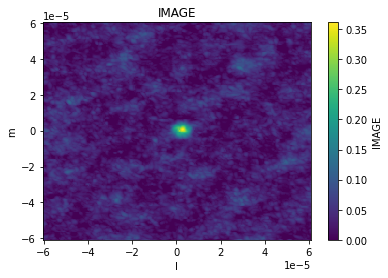
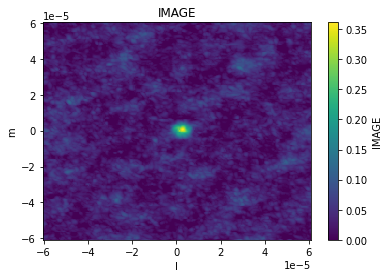
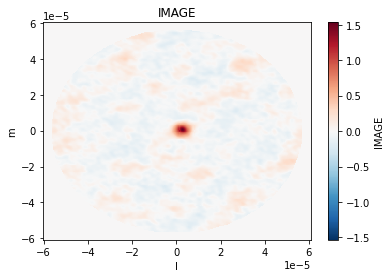
imcontsub
Apparently someone the naming of line and continuum files is reversed
[44]:
# CASA6
from casatasks import imcontsub

os.system('rm -fr casa6.*.image')
imcontsub(imagename="twhya.image", linefile="casa6.line.image", contfile="casa6.cont.image", fitorder=2, chans='1~3,7~9')

casa_linefit = convert_image('casa6.line.image')
casa_contsub = convert_image('casa6.cont.image')

implot(casa_linefit.IMAGE.where(casa_linefit.IMAGE_MASK0))
implot(casa_contsub.IMAGE.where(casa_contsub.IMAGE_MASK0))
converting Image...
processed image in 0.38849592 seconds
converting Image...
processed image in 0.37773752 seconds
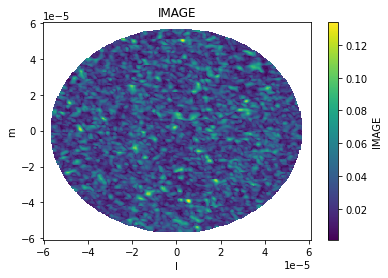
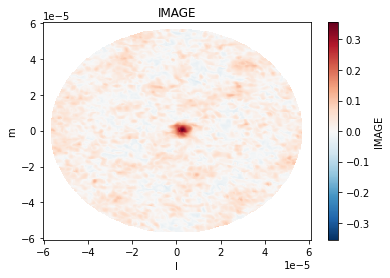
[45]:
# CNGI
from cngi.image import cont_sub

cngi_xds = cont_sub(image_xds.where(image_xds.IMAGE_MASK0), dv='IMAGE', fitorder=2, chans=[1,2,3,7,8,9], linename='LINE', contname='CONTINUUM')

implot(cngi_xds.LINE)
implot(cngi_xds.CONTINUUM)
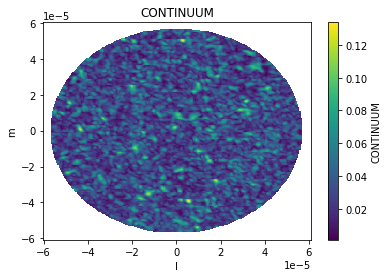
[46]:
# Delta
print('max delta : ', np.nanmax(np.abs((casa_linefit.IMAGE - cngi_xds.CONTINUUM).values)))
print('max delta : ', np.nanmax(np.abs((casa_contsub.IMAGE.where(casa_contsub.IMAGE_MASK0) - cngi_xds.LINE).values)))
max delta :  1.4396755787515758e-08
max delta :  1.4896446964840493e-08
imdev - TBD
Pending implementation of statistics, this will likely be done directly on the xds by calling xds.rolling() with the new statistics function
immath
Note that only ‘evalexpr’ mode is shown here. ‘spix’ mode should instead use cngi.image.spixfit and ‘poli’/’pola’ modes should compute the math manually
[47]:
# CASA6
from casatasks import immath

os.system("rm -fr casa6.math.image")
immath(imagename='twhya.image', expr='sin(IM0)', outfile='casa6.math.image')

casa_xds = convert_image('casa6.math.image')
implot(casa_xds.IMAGE)
converting Image...
processed image in 0.39214063 seconds
[48]:
# CNGI
cngi_xda = np.sin(image_xds.IMAGE)

implot(cngi_xda)
[49]:
# Delta
print('max delta : ', np.abs((casa_xds.IMAGE - cngi_xda).values).max())
max delta : 1.4870845721492998e-08
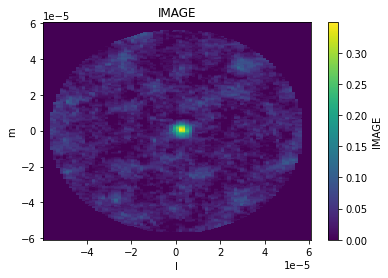
immoments
[50]:
# CASA6
from casatasks import immoments

os.system('rm -rf casa6.immoments.image*')
immoments(imagename='twhya.image', axis='spectral', moments=[0], outfile='casa6.immoments.image')

casa_xds = convert_image('casa6.immoments.image')

implot(casa_xds.IMAGE)
converting Image...
processed image in 0.20693302 seconds
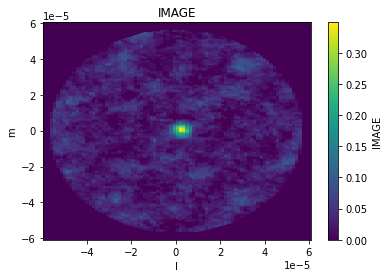
[51]:
# CNGI
from cngi.image import moments

cngi_xds = moments(image_xds.where(image_xds.IMAGE_MASK0), moment=[0])

implot(cngi_xds.MOMENTS_INTEGRATED)
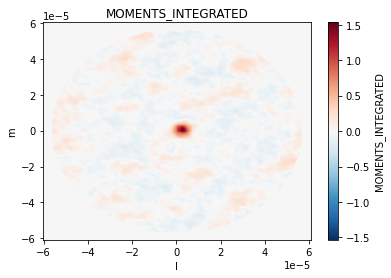
[52]:
# Delta
print('max delta : ', np.abs((casa_xds.IMAGE - cngi_xds.MOMENTS_INTEGRATED).values).max())
max delta : 5.094286832374451e-07
imrebin
Note that CASA bins pixels starting from the edge of the mask/region. CNGI bins pixels starting from the edge of the image (ignoring values in masked pixels). This creates a discrepency in output at the edge of masks.
[53]:
# CASA6
from casatasks import imrebin

imrebin(imagename='twhya.image', outfile='casa6.rebin.image', factor=3, overwrite=True)

casa_xds = convert_image('casa6.rebin.image')
implot(casa_xds.IMAGE)
converting Image...
processed image in 0.2709217 seconds
[54]:
# CNGI
from cngi.image import rebin

cngi_xds = rebin(image_xds.where(image_xds.IMAGE_MASK0), axis='l', factor=3)

implot(cngi_xds.IMAGE)
[55]:
# Delta
print('max delta : ', np.abs((casa_xds.IMAGE - cngi_xds.IMAGE).values).max())
max delta : 0.05339271823565166
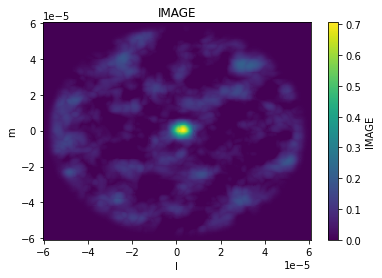
imsmooth
Note there is currently a discrepency in output that is not understood
[56]:
# CASA6
from casatasks import imsmooth

imsmooth('twhya.image', kernel='gaussian', targetres=True, outfile='casa6.smooth.image',
         overwrite=True, beam = {"major": "1arcsec", "minor": "1arcsec", "pa": "30deg"});

casa_xds = convert_image('casa6.smooth.image')
implot(casa_xds.IMAGE)
converting Image...
processed image in 0.38987756 seconds
[57]:
# CNGI
from cngi.image import smooth

cngi_xds = smooth(image_xds.where(image_xds.IMAGE_MASK0, other=0), kernel='gaussian', size=[1., 1., 30.],
                  current=image_xds.commonbeam, name='TARGET_BEAM')

implot(cngi_xds.IMAGE)

[58]:
# Delta
print('max delta : ', np.abs((casa_xds.IMAGE - cngi_xds.IMAGE).values).max())
max delta : 0.3243054985856718
imsubimage
[59]:
# CASA6
from casatasks import imsubimage

imsubimage('twhya.image', outfile='casa6.subimage.image', box='85,100,134,149', overwrite=True)

casa_xds = convert_image('casa6.subimage.image')
implot(casa_xds.IMAGE)
converting Image...
processed image in 0.1738503 seconds
[60]:
# CNGI
cngi_xds = image_xds.isel(l=range(85,135), m=range(100,150))

implot(cngi_xds.IMAGE)

[61]:
# Delta
print('max delta : ', np.abs((casa_xds.IMAGE - cngi_xds.IMAGE).values).max())
max delta : 0.0
imstat
[62]:
# CASA6
from casatasks import imstat

casa_stats = imstat('twhya.image')

casa_stats
[62]:
{'blc': array([0, 0, 0, 0]),
 'blcf': '11:01:52.810, -34.42.29.866, I, 3.7252e+11Hz',
 'flux': array([6.27340375]),
 'max': array([0.36960047]),
 'maxpos': array([120, 127,   0,   1]),
 'maxposf': '11:01:51.837, -34.42.17.166, I, 3.725206e+11Hz',
 'mean': array([0.00110953]),
 'medabsdevmed': array([0.01520567]),
 'median': array([0.]),
 'min': array([-0.10551776]),
 'minpos': array([ 94, 193,   0,   3]),
 'minposf': '11:01:52.047, -34.42.10.566, I, 3.725219e+11Hz',
 'npts': array([429530.]),
 'q1': array([-0.01529752]),
 'q3': array([0.01509237]),
 'quartile': array([0.03038988]),
 'rms': array([0.02771565]),
 'sigma': array([0.02769347]),
 'sum': array([476.57430563]),
 'sumsq': array([329.94660415]),
 'trc': array([249, 249,   0,   9]),
 'trcf': '11:01:50.790, -34.42.04.966, I, 3.725255e+11Hz'}
[63]:
# CNGI
from cngi.image import statistics

cngi_stats = statistics(image_xds, compute=True).statistics

cngi_stats
[63]:
{'blc': array([0, 0, 0, 0, 0]),
 'blcf': ['11:01:52.80971154',
  '-34.42.29.86573768',
  '2012-11-19T07:56:26.544000626',
  372520022603.63745,
  1.0],
 'max': 0.36960047483444214,
 'maxpos': [120, 127, 0, 1, 0],
 'maxposf': ['11:01:51.83654673',
  '-34.42.17.16599958',
  '2012-11-19T07:56:26.544000626',
  372520632933.7965,
  1.0],
 'mean': 0.0005451506748828763,
 'medabsdevmed': 0.014964754227548838,
 'median': 0.0,
 'min': -0.10752750933170319,
 'minpos': [27, 199, 0, 3, 0],
 'minposf': ['11:01:52.59069674',
  '-34.42.09.96583877',
  '2012-11-19T07:56:26.544000626',
  372521853594.1146,
  1.0],
 'npts': 625000,
 'q1': -0.01533513329923153,
 'q3': 0.014549590414389968,
 'quartile': 0.029884723713621497,
 'rms': 0.026438209534621095,
 'sigma': 0.026432588487286,
 'sum': 340.71917180179764,
 'sumsq': 436.8618271228311,
 'trc': array([249, 249,   0,   9,   0]),
 'trcf': ['11:01:50.79048222',
  '-34.42.04.96574187',
  '2012-11-19T07:56:26.544000626',
  372525515575.069,
  1.0]}
[64]:
# Delta
print('max delta : ', np.abs([casa_stats['medabsdevmed']-cngi_stats['medabsdevmed'], casa_stats['q1']-cngi_stats['q1']]).max())
max delta : 0.00024092057719826698
imtrans
Note the image converter will swap the transposed axes back, so we have to work around that here to show the effect
[65]:
# CASA6
from casatasks import imtrans

os.system("rm -fr casa6.trans.image")
imtrans('twhya.image', outfile='casa6.trans.image', order='1023')

casa_image = imval('casa6.trans.image', box='0,0,249,249', chans='2')['data']

plt.imshow(casa_image)
[65]:
<matplotlib.image.AxesImage at 0x7f5de9a22690>
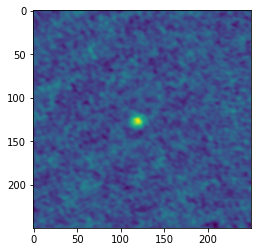
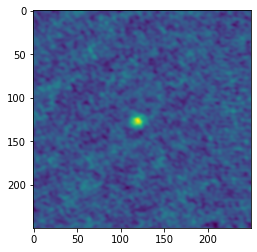
[66]:
# CNGI
cngi_xds = image_xds.transpose('m','l','time','chan','pol')

plt.imshow(cngi_xds.IMAGE[:,:,0,2,0].values)
[66]:
<matplotlib.image.AxesImage at 0x7f5de7798950>
[67]:
# Delta
print('max delta : ', np.abs(casa_image - cngi_xds.IMAGE[:,:,0,2,0].values).max())
max delta : 0.0
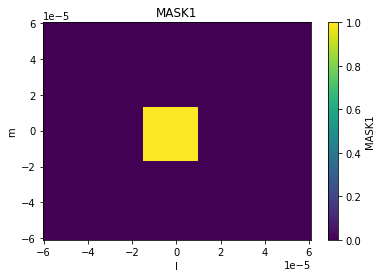
makemask
[68]:
# CASA6
from casatasks import makemask

makemask(mode='copy', inpimage='twhya.image', inpmask='box[[2.887905rad, -0.60573rad], [2.887935rad, -0.60570rad]]',
         output='casa6.makemask.image', overwrite=True)

casa_xds = convert_image('casa6.makemask.image')
implot(casa_xds.IMAGE)
converting Image...
processed image in 0.22030282 seconds

[69]:
# CNGI
from cngi.image import region

# note that CASA swaps the meaning of 0/1 between regions and masks, CNGI does not
# so replicating the values of a CASA mask requires us to use a CNGI region
cngi_xds = region(image_xds, 'MASK1', ra=[2.887905, 2.887935], dec=[-0.60573, -0.60570])

implot(cngi_xds.MASK1)
[70]:
# Delta
print('max delta : ', np.abs((casa_xds.IMAGE - cngi_xds.MASK1).values).max())
max delta : 0.0
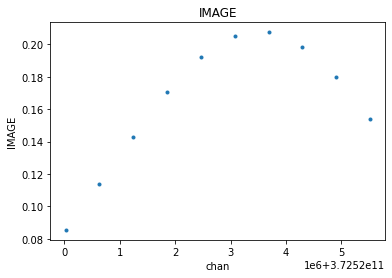
specfit
[71]:
from casatasks import specfit

os.system('rm -fr casa6.specfit.image')
rc = specfit('twhya.image', box="125,125,125,125", model='casa6.specfit.image', pampest=1.5, pcenterest=0, pfwhmest=5, ngauss=1, multifit=False)

casa_xds = convert_image('casa6.specfit.image')
implot(casa_xds.IMAGE[0,0,0,:,0], axis=['chan'])
converting Image...
processed image in 0.16069746 seconds
[72]:
from cngi.image import spec_fit

cngi_xds = spec_fit(image_xds, dv='IMAGE', pixel=(125,125), sigma=2000, name='FIT')

implot(cngi_xds.FIT, axis='chan', overplot=True)
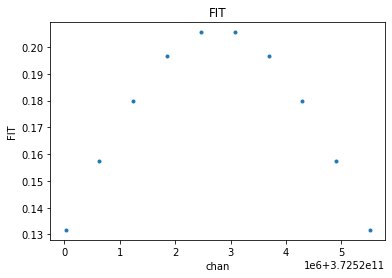
[73]:
# Delta
print('max delta : ', np.abs((casa_xds.IMAGE[0,0,0,:,0] - cngi_xds.FIT).values).max())
max delta : 0.04620384288038856