Open in Colab: https://colab.research.google.com/github/casangi/cngi_prototype/blob/master/docs/imaging/mosaic_image_example.ipynb
Mosaic Imaging
This notebook will demonstrate how to create a joint mosaic image. Data is taken from all the pointings in an input visibility dataset and combined to have a single phase-reference center.
This walkthrough is designed to be run in a Jupyter notebook on Google Colaboratory. To open the notebook in colab, go here.
Installation
[1]:
import os
os.system("pip install cngi-prototype==0.0.91")
print('complete')
complete
Dataset
The simulated dataset consists of three fields which contain four point sources over three frequency channels. The ALMA layout alma.cycle6.3.cfg is used, which can be found here.
[2]:
!gdown -q --id 1KzWk0Xg8-xpljTL6m8WEE8KbfLTpskRg
!unzip alma12m_3field_dovpTrue.vis.zarr.zip > /dev/null

!gdown -q --id 1YdJGBi2qtdCuJ6dm4xrXU5zvXeJc7w3v
!unzip alma12m_3field_dovpTrue_gridder_mosaic.img.zarr.zip > /dev/null

#%matplotlib widget
Load Dataset
[3]:
import xarray as xr
from cngi.dio import read_vis

xr.set_options(display_style="html")

infile = "alma12m_3field_dovpTrue.vis.zarr"
mxds = read_vis(infile)
mxds
overwrite_encoded_chunks True
[3]:
<xarray.Dataset>
Dimensions:           (antenna_ids: 43, feed_ids: 43, field_ids: 3, observation_ids: 1, polarization_ids: 1, source_ids: 3, spw_ids: 1, state_ids: 1)
Coordinates:
  * antenna_ids       (antenna_ids) int64 0 1 2 3 4 5 6 ... 36 37 38 39 40 41 42
    antennas          (antenna_ids) <U16 'A001' 'A002' 'A007' ... 'A085' 'A088'
  * field_ids         (field_ids) int64 0 1 2
    fields            (field_ids) <U16 'field_1' 'field_2' 'field_3'
  * feed_ids          (feed_ids) int32 0 0 0 0 0 0 0 0 0 0 ... 0 0 0 0 0 0 0 0 0
  * observation_ids   (observation_ids) int64 0
    observations      (observation_ids) <U16 'CASA simulation'
  * polarization_ids  (polarization_ids) int64 0
  * source_ids        (source_ids) int32 0 1 2
    sources           (source_ids) <U16 'field_1' 'field_2' 'field_3'
  * spw_ids           (spw_ids) int64 0
  * state_ids         (state_ids) int64 0
Data variables:
    *empty*
Attributes:
    xds0:             <xarray.Dataset>\nDimensions:                (baseline:...
    ANTENNA:          <xarray.Dataset>\nDimensions:        (antenna_id: 43, d...
    FEED:             <xarray.Dataset>\nDimensions:             (d0: 43, d1: ...
    FIELD:            <xarray.Dataset>\nDimensions:        (d1: 1, d2: 2, fie...
    OBSERVATION:      <xarray.Dataset>\nDimensions:         (d1: 2, observati...
    POINTING:         <xarray.Dataset>\nDimensions:      (antenna_id: 43, d2:...
    POLARIZATION:     <xarray.Dataset>\nDimensions:       (d0: 1, d1: 1, d2: ...
    SOURCE:           <xarray.Dataset>\nDimensions:             (d0: 3, d1: 2...
    SPECTRAL_WINDOW:  <xarray.Dataset>\nDimensions:             (d1: 3, spect...
STATE: <xarray.Dataset>\nDimensions: (state_id: 1)\nCoordina...- antenna_ids: 43
- feed_ids: 43
- field_ids: 3
- observation_ids: 1
- polarization_ids: 1
- source_ids: 3
- spw_ids: 1
- state_ids: 1
- antenna_ids(antenna_ids)int640 1 2 3 4 5 6 ... 37 38 39 40 41 42
array([ 0, 1, 2, 3, 4, 5, 6, 7, 8, 9, 10, 11, 12, 13, 14, 15, 16, 17, 18, 19, 20, 21, 22, 23, 24, 25, 26, 27, 28, 29, 30, 31, 32, 33, 34, 35, 36, 37, 38, 39, 40, 41, 42]) - antennas(antenna_ids)<U16'A001' 'A002' ... 'A085' 'A088'
array(['A001', 'A002', 'A007', 'A008', 'A010', 'A011', 'A015', 'A016', 'A022', 'A023', 'A024', 'A025', 'A026', 'A027', 'A033', 'A034', 'A035', 'A036', 'A040', 'A042', 'A043', 'A044', 'A045', 'A047', 'A048', 'A049', 'A050', 'A058', 'A060', 'A062', 'A066', 'A068', 'A069', 'A070', 'A072', 'A073', 'A074', 'A075', 'A076', 'A082', 'A083', 'A085', 'A088'], dtype='<U16') - field_ids(field_ids)int640 1 2
array([0, 1, 2])
- fields(field_ids)<U16'field_1' 'field_2' 'field_3'
array(['field_1', 'field_2', 'field_3'], dtype='<U16')
- feed_ids(feed_ids)int320 0 0 0 0 0 0 0 ... 0 0 0 0 0 0 0 0
array([0, 0, 0, 0, 0, 0, 0, 0, 0, 0, 0, 0, 0, 0, 0, 0, 0, 0, 0, 0, 0, 0, 0, 0, 0, 0, 0, 0, 0, 0, 0, 0, 0, 0, 0, 0, 0, 0, 0, 0, 0, 0, 0], dtype=int32) - observation_ids(observation_ids)int640
array([0])
- observations(observation_ids)<U16'CASA simulation'
array(['CASA simulation'], dtype='<U16')
- polarization_ids(polarization_ids)int640
array([0])
- source_ids(source_ids)int320 1 2
array([0, 1, 2], dtype=int32)
- sources(source_ids)<U16'field_1' 'field_2' 'field_3'
array(['field_1', 'field_2', 'field_3'], dtype='<U16')
- spw_ids(spw_ids)int640
array([0])
- state_ids(state_ids)int640
array([0])
- xds0 :
- <xarray.Dataset> Dimensions: (baseline: 903, chan: 3, pol: 1, pol_id: 1, spw_id: 1, time: 192, uvw_index: 3) Coordinates: * baseline (baseline) int64 0 1 2 3 4 5 ... 898 899 900 901 902 * chan (chan) float64 3.4e+11 3.74e+11 4.08e+11 chan_width (chan) float64 dask.array<chunksize=(1,), meta=np.ndarray> effective_bw (chan) float64 dask.array<chunksize=(1,), meta=np.ndarray> * pol (pol) int32 9 * pol_id (pol_id) int32 0 resolution (chan) float64 dask.array<chunksize=(1,), meta=np.ndarray> * spw_id (spw_id) int32 0 * time (time) datetime64[ns] 2011-05-27T04:32:14.77260398... Dimensions without coordinates: uvw_index Data variables: (12/20) ANTENNA1 (baseline) int32 dask.array<chunksize=(301,), meta=np.ndarray> ANTENNA2 (baseline) int32 dask.array<chunksize=(301,), meta=np.ndarray> ARRAY_ID (time, baseline) int32 dask.array<chunksize=(32, 301), meta=np.ndarray> CORRECTED_DATA (time, baseline, chan, pol) complex128 dask.array<chunksize=(32, 301, 1, 1), meta=np.ndarray> CORRECTED_DATA_WEIGHT (time, baseline, chan, pol) float64 dask.array<chunksize=(32, 301, 1, 1), meta=np.ndarray> DATA (time, baseline, chan, pol) complex128 dask.array<chunksize=(32, 301, 1, 1), meta=np.ndarray> ... ... OBSERVATION_ID (time, baseline) int32 dask.array<chunksize=(32, 301), meta=np.ndarray> PROCESSOR_ID (time, baseline) int32 dask.array<chunksize=(32, 301), meta=np.ndarray> SCAN_NUMBER (time, baseline) int32 dask.array<chunksize=(32, 301), meta=np.ndarray> STATE_ID (time, baseline) int32 dask.array<chunksize=(32, 301), meta=np.ndarray> TIME_CENTROID (time, baseline) float64 dask.array<chunksize=(32, 301), meta=np.ndarray> UVW (time, baseline, uvw_index) float64 dask.array<chunksize=(32, 301, 3), meta=np.ndarray> Attributes: corr_product: [[0, 0]] data_groups: [{'0': {'data': 'DATA', 'flag': 'FLAG', 'id': '0', 'uvw... freq_group: 0 freq_group_name: Group 1 if_conv_chain: 0 meas_freq_ref: 1 name: Band_8 net_sideband: 1 num_chan: 3 num_corr: 1 ref_frequency: 340000000000.0 total_bandwidth: 101999999999.99998
- ANTENNA :
- <xarray.Dataset> Dimensions: (antenna_id: 43, d1: 3) Coordinates: * antenna_id (antenna_id) int64 0 1 2 3 4 5 6 7 ... 36 37 38 39 40 41 42 Dimensions without coordinates: d1 Data variables: DISH_DIAMETER (antenna_id) float64 dask.array<chunksize=(43,), meta=np.ndarray> MOUNT (antenna_id) <U16 dask.array<chunksize=(43,), meta=np.ndarray> NAME (antenna_id) <U16 dask.array<chunksize=(43,), meta=np.ndarray> OFFSET (antenna_id, d1) float64 dask.array<chunksize=(43, 3), meta=np.ndarray> POSITION (antenna_id, d1) float64 dask.array<chunksize=(43, 3), meta=np.ndarray> STATION (antenna_id) <U16 dask.array<chunksize=(43,), meta=np.ndarray> TYPE (antenna_id) <U16 dask.array<chunksize=(43,), meta=np.ndarray>
- FEED :
- <xarray.Dataset> Dimensions: (d0: 43, d1: 3, d2: 2, d3: 2) Coordinates: antenna_id (d0) int32 dask.array<chunksize=(43,), meta=np.ndarray> beam_id (d0) int32 dask.array<chunksize=(43,), meta=np.ndarray> feed_id (d0) int32 dask.array<chunksize=(43,), meta=np.ndarray> spectral_window_id (d0) int32 dask.array<chunksize=(43,), meta=np.ndarray> Dimensions without coordinates: d0, d1, d2, d3 Data variables: BEAM_OFFSET (d0, d2, d3) float64 dask.array<chunksize=(43, 2, 2), meta=np.ndarray> INTERVAL (d0) float64 dask.array<chunksize=(43,), meta=np.ndarray> NUM_RECEPTORS (d0) int32 dask.array<chunksize=(43,), meta=np.ndarray> POLARIZATION_TYPE (d0, d2) <U16 dask.array<chunksize=(43, 2), meta=np.ndarray> POL_RESPONSE (d0, d2, d3) complex128 dask.array<chunksize=(43, 2, 2), meta=np.ndarray> POSITION (d0, d1) float64 dask.array<chunksize=(43, 3), meta=np.ndarray> RECEPTOR_ANGLE (d0, d2) float64 dask.array<chunksize=(43, 2), meta=np.ndarray> TIME (d0) datetime64[ns] dask.array<chunksize=(43,), meta=np.ndarray> Attributes: name: FEED table
- FIELD :
- <xarray.Dataset> Dimensions: (d1: 1, d2: 2, field_id: 3) Coordinates: * field_id (field_id) int64 0 1 2 source_id (field_id) int32 dask.array<chunksize=(3,), meta=np.ndarray> Dimensions without coordinates: d1, d2 Data variables: CODE (field_id) <U16 dask.array<chunksize=(3,), meta=np.ndarray> DELAY_DIR (field_id, d1, d2) float64 dask.array<chunksize=(3, 1, 2), meta=np.ndarray> NAME (field_id) <U16 dask.array<chunksize=(3,), meta=np.ndarray> NUM_POLY (field_id) int32 dask.array<chunksize=(3,), meta=np.ndarray> PHASE_DIR (field_id, d1, d2) float64 dask.array<chunksize=(3, 1, 2), meta=np.ndarray> REFERENCE_DIR (field_id, d1, d2) float64 dask.array<chunksize=(3, 1, 2), meta=np.ndarray> TIME (field_id) datetime64[ns] dask.array<chunksize=(3,), meta=np.ndarray>
- OBSERVATION :
- <xarray.Dataset> Dimensions: (d1: 2, observation_id: 1) Coordinates: * observation_id (observation_id) int64 0 Dimensions without coordinates: d1 Data variables: OBSERVER (observation_id) <U16 dask.array<chunksize=(1,), meta=np.ndarray> PROJECT (observation_id) <U16 dask.array<chunksize=(1,), meta=np.ndarray> RELEASE_DATE (observation_id) float64 dask.array<chunksize=(1,), meta=np.ndarray> SCHEDULE_TYPE (observation_id) <U16 dask.array<chunksize=(1,), meta=np.ndarray> TELESCOPE_NAME (observation_id) <U16 dask.array<chunksize=(1,), meta=np.ndarray> TIME_RANGE (observation_id, d1) float64 dask.array<chunksize=(1, 2), meta=np.ndarray>
- POINTING :
- <xarray.Dataset> Dimensions: (antenna_id: 43, d2: 1, d3: 2, time: 192) Coordinates: * antenna_id (antenna_id) int32 0 1 2 3 4 5 6 7 ... 35 36 37 38 39 40 41 42 * time (time) datetime64[ns] 2011-05-27T04:32:14.772603989 ... 2011... Dimensions without coordinates: d2, d3 Data variables: DIRECTION (time, antenna_id, d2, d3) float64 dask.array<chunksize=(32, 43, 1, 2), meta=np.ndarray> INTERVAL (time, antenna_id) float64 dask.array<chunksize=(32, 43), meta=np.ndarray> NAME (time, antenna_id) <U16 dask.array<chunksize=(32, 43), meta=np.ndarray> NUM_POLY (time, antenna_id) int32 dask.array<chunksize=(32, 43), meta=np.ndarray> TARGET (time, antenna_id, d2, d3) float64 dask.array<chunksize=(32, 43, 1, 2), meta=np.ndarray> TIME_ORIGIN (time, antenna_id) float64 dask.array<chunksize=(32, 43), meta=np.ndarray> TRACKING (time, antenna_id) bool dask.array<chunksize=(32, 43), meta=np.ndarray>
- POLARIZATION :
- <xarray.Dataset> Dimensions: (d0: 1, d1: 1, d2: 2) Dimensions without coordinates: d0, d1, d2 Data variables: CORR_PRODUCT (d0, d1, d2) int32 dask.array<chunksize=(1, 1, 2), meta=np.ndarray> CORR_TYPE (d0, d1) int32 dask.array<chunksize=(1, 1), meta=np.ndarray> NUM_CORR (d0) int32 dask.array<chunksize=(1,), meta=np.ndarray> Attributes: name: POLARIZATION table
- SOURCE :
- <xarray.Dataset> Dimensions: (d0: 3, d1: 2, d2: 1) Coordinates: pulsar_id (d0) int32 dask.array<chunksize=(3,), meta=np.ndarray> source_id (d0) int32 dask.array<chunksize=(3,), meta=np.ndarray> spectral_window_id (d0) int32 dask.array<chunksize=(3,), meta=np.ndarray> Dimensions without coordinates: d0, d1, d2 Data variables: CALIBRATION_GROUP (d0) int32 dask.array<chunksize=(3,), meta=np.ndarray> CODE (d0) <U16 dask.array<chunksize=(3,), meta=np.ndarray> DIRECTION (d0, d1) float64 dask.array<chunksize=(3, 2), meta=np.ndarray> INTERVAL (d0) float64 dask.array<chunksize=(3,), meta=np.ndarray> NAME (d0) <U16 dask.array<chunksize=(3,), meta=np.ndarray> NUM_LINES (d0) int32 dask.array<chunksize=(3,), meta=np.ndarray> PROPER_MOTION (d0, d1) float64 dask.array<chunksize=(3, 2), meta=np.ndarray> REST_FREQUENCY (d0, d2) float64 dask.array<chunksize=(3, 1), meta=np.ndarray> SYSVEL (d0, d2) float64 dask.array<chunksize=(3, 1), meta=np.ndarray> TIME (d0) datetime64[ns] dask.array<chunksize=(3,), meta=np.ndarray> TRANSITION (d0, d2) <U16 dask.array<chunksize=(3, 1), meta=np.ndarray> Attributes: bad_cols: ['POSITION'] name: SOURCE table
- SPECTRAL_WINDOW :
- <xarray.Dataset> Dimensions: (d1: 3, spectral_window_id: 1) Coordinates: * spectral_window_id (spectral_window_id) int64 0 Dimensions without coordinates: d1 Data variables: (12/13) CHAN_FREQ (spectral_window_id, d1) float64 dask.array<chunksize=(1, 3), meta=np.ndarray> CHAN_WIDTH (spectral_window_id, d1) float64 dask.array<chunksize=(1, 3), meta=np.ndarray> EFFECTIVE_BW (spectral_window_id, d1) float64 dask.array<chunksize=(1, 3), meta=np.ndarray> FREQ_GROUP (spectral_window_id) int32 dask.array<chunksize=(1,), meta=np.ndarray> FREQ_GROUP_NAME (spectral_window_id) <U16 dask.array<chunksize=(1,), meta=np.ndarray> IF_CONV_CHAIN (spectral_window_id) int32 dask.array<chunksize=(1,), meta=np.ndarray> ... ... NAME (spectral_window_id) <U16 dask.array<chunksize=(1,), meta=np.ndarray> NET_SIDEBAND (spectral_window_id) int32 dask.array<chunksize=(1,), meta=np.ndarray> NUM_CHAN (spectral_window_id) int32 dask.array<chunksize=(1,), meta=np.ndarray> REF_FREQUENCY (spectral_window_id) float64 dask.array<chunksize=(1,), meta=np.ndarray> RESOLUTION (spectral_window_id, d1) float64 dask.array<chunksize=(1, 3), meta=np.ndarray> TOTAL_BANDWIDTH (spectral_window_id) float64 dask.array<chunksize=(1,), meta=np.ndarray>
- STATE :
- <xarray.Dataset> Dimensions: (state_id: 1) Coordinates: * state_id (state_id) int64 0 Data variables: CAL (state_id) float64 dask.array<chunksize=(1,), meta=np.ndarray> LOAD (state_id) float64 dask.array<chunksize=(1,), meta=np.ndarray> OBS_MODE (state_id) <U25 dask.array<chunksize=(1,), meta=np.ndarray> REF (state_id) bool dask.array<chunksize=(1,), meta=np.ndarray> SIG (state_id) bool dask.array<chunksize=(1,), meta=np.ndarray> SUB_SCAN (state_id) int32 dask.array<chunksize=(1,), meta=np.ndarray>
[4]:
mxds.xds0
[4]:
<xarray.Dataset>
Dimensions:                (baseline: 903, chan: 3, pol: 1, pol_id: 1, spw_id: 1, time: 192, uvw_index: 3)
Coordinates:
  * baseline               (baseline) int64 0 1 2 3 4 5 ... 898 899 900 901 902
  * chan                   (chan) float64 3.4e+11 3.74e+11 4.08e+11
    chan_width             (chan) float64 dask.array<chunksize=(1,), meta=np.ndarray>
    effective_bw           (chan) float64 dask.array<chunksize=(1,), meta=np.ndarray>
  * pol                    (pol) int32 9
  * pol_id                 (pol_id) int32 0
    resolution             (chan) float64 dask.array<chunksize=(1,), meta=np.ndarray>
  * spw_id                 (spw_id) int32 0
  * time                   (time) datetime64[ns] 2011-05-27T04:32:14.77260398...
Dimensions without coordinates: uvw_index
Data variables: (12/20)
    ANTENNA1               (baseline) int32 dask.array<chunksize=(301,), meta=np.ndarray>
    ANTENNA2               (baseline) int32 dask.array<chunksize=(301,), meta=np.ndarray>
    ARRAY_ID               (time, baseline) int32 dask.array<chunksize=(32, 301), meta=np.ndarray>
    CORRECTED_DATA         (time, baseline, chan, pol) complex128 dask.array<chunksize=(32, 301, 1, 1), meta=np.ndarray>
    CORRECTED_DATA_WEIGHT  (time, baseline, chan, pol) float64 dask.array<chunksize=(32, 301, 1, 1), meta=np.ndarray>
    DATA                   (time, baseline, chan, pol) complex128 dask.array<chunksize=(32, 301, 1, 1), meta=np.ndarray>
    ...                     ...
    OBSERVATION_ID         (time, baseline) int32 dask.array<chunksize=(32, 301), meta=np.ndarray>
    PROCESSOR_ID           (time, baseline) int32 dask.array<chunksize=(32, 301), meta=np.ndarray>
    SCAN_NUMBER            (time, baseline) int32 dask.array<chunksize=(32, 301), meta=np.ndarray>
    STATE_ID               (time, baseline) int32 dask.array<chunksize=(32, 301), meta=np.ndarray>
    TIME_CENTROID          (time, baseline) float64 dask.array<chunksize=(32, 301), meta=np.ndarray>
    UVW                    (time, baseline, uvw_index) float64 dask.array<chunksize=(32, 301, 3), meta=np.ndarray>
Attributes:
    corr_product:     [[0, 0]]
    data_groups:      [{'0': {'data': 'DATA', 'flag': 'FLAG', 'id': '0', 'uvw...
    freq_group:       0
    freq_group_name:  Group 1
    if_conv_chain:    0
    meas_freq_ref:    1
    name:             Band_8
    net_sideband:     1
    num_chan:         3
    num_corr:         1
    ref_frequency:    340000000000.0
total_bandwidth: 101999999999.99998- baseline: 903
- chan: 3
- pol: 1
- pol_id: 1
- spw_id: 1
- time: 192
- uvw_index: 3
- baseline(baseline)int640 1 2 3 4 5 ... 898 899 900 901 902
array([ 0, 1, 2, ..., 900, 901, 902])
- chan(chan)float643.4e+11 3.74e+11 4.08e+11
array([3.40e+11, 3.74e+11, 4.08e+11])
- chan_width(chan)float64dask.array<chunksize=(1,), meta=np.ndarray>
Array Chunk Bytes 24 B 8 B Shape (3,) (1,) Count 4 Tasks 3 Chunks Type float64 numpy.ndarray - effective_bw(chan)float64dask.array<chunksize=(1,), meta=np.ndarray>
Array Chunk Bytes 24 B 8 B Shape (3,) (1,) Count 4 Tasks 3 Chunks Type float64 numpy.ndarray - pol(pol)int329
array([9], dtype=int32)
- pol_id(pol_id)int320
array([0], dtype=int32)
- resolution(chan)float64dask.array<chunksize=(1,), meta=np.ndarray>
Array Chunk Bytes 24 B 8 B Shape (3,) (1,) Count 4 Tasks 3 Chunks Type float64 numpy.ndarray - spw_id(spw_id)int320
array([0], dtype=int32)
- time(time)datetime64[ns]2011-05-27T04:32:14.772603989 .....
array(['2011-05-27T04:32:14.772603989', '2011-05-27T04:42:14.772603989',
       '2011-05-27T04:52:14.772603989', '2011-05-27T05:02:14.772603989',
       '2011-05-27T05:12:14.772603989', '2011-05-27T05:22:14.772603989',
       '2011-05-27T05:32:14.772603989', '2011-05-27T05:42:14.772603989',
       '2011-05-27T05:52:14.772603989', '2011-05-27T06:02:14.772603989',
       '2011-05-27T06:12:14.772603989', '2011-05-27T06:22:14.772603989',
       '2011-05-27T06:32:14.772603989', '2011-05-27T06:42:14.772603989',
       '2011-05-27T06:52:14.772603989', '2011-05-27T07:02:14.772603989',
       '2011-05-27T07:12:14.772603989', '2011-05-27T07:22:14.772603989',
       '2011-05-27T07:32:14.772603989', '2011-05-27T07:42:14.772603989',
       '2011-05-27T07:52:14.772603989', '2011-05-27T08:02:14.772603989',
       '2011-05-27T08:12:14.772603989', '2011-05-27T08:22:14.772603989',
       '2011-05-27T08:32:14.772603989', '2011-05-27T08:42:14.772603989',
       '2011-05-27T08:52:14.772603989', '2011-05-27T09:02:14.772603989',
       '2011-05-27T09:12:14.772603989', '2011-05-27T09:22:14.772603989',
       '2011-05-27T09:32:14.772603989', '2011-05-27T09:42:14.772603989',
       '2011-05-27T09:52:14.772603989', '2011-05-27T10:02:14.772603989',
       '2011-05-27T10:12:14.772603989', '2011-05-27T10:22:14.772603989',
       '2011-05-27T10:32:14.772603989', '2011-05-27T10:42:14.772603989',
       '2011-05-27T10:52:14.772603989', '2011-05-27T11:02:14.772603989',
       '2011-05-27T11:12:14.772603989', '2011-05-27T11:22:14.772603989',
       '2011-05-27T11:32:14.772603989', '2011-05-27T11:42:14.772603989',
       '2011-05-27T11:52:14.772603989', '2011-05-27T12:02:14.772603989',
       '2011-05-27T12:12:14.772603989', '2011-05-27T12:22:14.772603989',
       '2011-05-27T12:32:14.772603989', '2011-05-27T12:42:14.772603989',
       '2011-05-27T12:52:14.772603989', '2011-05-27T13:02:14.772603989',
       '2011-05-27T13:12:14.772603989', '2011-05-27T13:22:14.772603989',
       '2011-05-27T13:32:14.772603989', '2011-05-27T13:42:14.772603989',
       '2011-05-27T13:52:14.772603989', '2011-05-27T14:02:14.772603989',
       '2011-05-27T14:12:14.772603989', '2011-05-27T14:22:14.772603989',
       '2011-05-27T14:32:14.772603989', '2011-05-27T14:42:14.772603989',
       '2011-05-27T14:52:14.772603989', '2011-05-27T15:02:14.772603989',
       '2011-05-27T15:12:14.772603989', '2011-05-27T15:22:14.772603989',
       '2011-05-27T15:32:14.772603989', '2011-05-27T15:42:14.772603989',
       '2011-05-27T15:52:14.772603989', '2011-05-27T16:02:14.772603989',
       '2011-05-27T16:12:14.772603989', '2011-05-27T16:22:14.772603989',
       '2011-05-27T16:32:14.772603989', '2011-05-27T16:42:14.772603989',
       '2011-05-27T16:52:14.772603989', '2011-05-27T17:02:14.772603989',
       '2011-05-27T17:12:14.772603989', '2011-05-27T17:22:14.772603989',
       '2011-05-27T17:32:14.772603989', '2011-05-27T17:42:14.772603989',
       '2011-05-27T17:52:14.772603989', '2011-05-27T18:02:14.772603989',
       '2011-05-27T18:12:14.772603989', '2011-05-27T18:22:14.772603989',
       '2011-05-27T18:32:14.772603989', '2011-05-27T18:42:14.772603989',
       '2011-05-27T18:52:14.772603989', '2011-05-27T19:02:14.772603989',
       '2011-05-27T19:12:14.772603989', '2011-05-27T19:22:14.772603989',
       '2011-05-27T19:32:14.772603989', '2011-05-27T19:42:14.772603989',
       '2011-05-27T19:52:14.772603989', '2011-05-27T20:02:14.772603989',
       '2011-05-27T20:12:14.772603989', '2011-05-27T20:22:14.772603989',
       '2011-05-27T20:32:14.772603989', '2011-05-27T20:42:14.772603989',
       '2011-05-27T20:52:14.772603989', '2011-05-27T21:02:14.772603989',
       '2011-05-27T21:12:14.772603989', '2011-05-27T21:22:14.772603989',
       '2011-05-27T21:32:14.772603989', '2011-05-27T21:42:14.772603989',
       '2011-05-27T21:52:14.772603989', '2011-05-27T22:02:14.772603989',
       '2011-05-27T22:12:14.772603989', '2011-05-27T22:22:14.772603989',
       '2011-05-27T22:32:14.772603989', '2011-05-27T22:42:14.772603989',
       '2011-05-27T22:52:14.772603989', '2011-05-27T23:02:14.772603989',
       '2011-05-27T23:12:14.772603989', '2011-05-27T23:22:14.772603989',
       '2011-05-27T23:32:14.772603989', '2011-05-27T23:42:14.772603989',
       '2011-05-27T23:52:14.772603989', '2011-05-28T00:02:14.772603989',
       '2011-05-28T00:12:14.772603989', '2011-05-28T00:22:14.772603989',
       '2011-05-28T00:32:14.772603989', '2011-05-28T00:42:14.772603989',
       '2011-05-28T00:52:14.772603989', '2011-05-28T01:02:14.772603989',
       '2011-05-28T01:12:14.772603989', '2011-05-28T01:22:14.772603989',
       '2011-05-28T01:32:14.772603989', '2011-05-28T01:42:14.772603989',
       '2011-05-28T01:52:14.772603989', '2011-05-28T02:02:14.772603989',
       '2011-05-28T02:12:14.772603989', '2011-05-28T02:22:14.772603989',
       '2011-05-28T02:32:14.772603989', '2011-05-28T02:42:14.772603989',
       '2011-05-28T02:52:14.772603989', '2011-05-28T03:02:14.772603989',
       '2011-05-28T03:12:14.772603989', '2011-05-28T03:22:14.772603989',
       '2011-05-28T03:32:14.772603989', '2011-05-28T03:42:14.772603989',
       '2011-05-28T03:52:14.772603989', '2011-05-28T04:02:14.772603989',
       '2011-05-28T04:12:14.772603989', '2011-05-28T04:22:14.772603989',
       '2011-05-28T04:32:14.772603989', '2011-05-28T04:42:14.772603989',
       '2011-05-28T04:52:14.772603989', '2011-05-28T05:02:14.772603989',
       '2011-05-28T05:12:14.772603989', '2011-05-28T05:22:14.772603989',
       '2011-05-28T05:32:14.772603989', '2011-05-28T05:42:14.772603989',
       '2011-05-28T05:52:14.772603989', '2011-05-28T06:02:14.772603989',
       '2011-05-28T06:12:14.772603989', '2011-05-28T06:22:14.772603989',
       '2011-05-28T06:32:14.772603989', '2011-05-28T06:42:14.772603989',
       '2011-05-28T06:52:14.772603989', '2011-05-28T07:02:14.772603989',
       '2011-05-28T07:12:14.772603989', '2011-05-28T07:22:14.772603989',
       '2011-05-28T07:32:14.772603989', '2011-05-28T07:42:14.772603989',
       '2011-05-28T07:52:14.772603989', '2011-05-28T08:02:14.772603989',
       '2011-05-28T08:12:14.772603989', '2011-05-28T08:22:14.772603989',
       '2011-05-28T08:32:14.772603989', '2011-05-28T08:42:14.772603989',
       '2011-05-28T08:52:14.772603989', '2011-05-28T09:02:14.772603989',
       '2011-05-28T09:12:14.772603989', '2011-05-28T09:22:14.772603989',
       '2011-05-28T09:32:14.772603989', '2011-05-28T09:42:14.772603989',
       '2011-05-28T09:52:14.772603989', '2011-05-28T10:02:14.772603989',
       '2011-05-28T10:12:14.772603989', '2011-05-28T10:22:14.772603989',
       '2011-05-28T10:32:14.772603989', '2011-05-28T10:42:14.772603989',
       '2011-05-28T10:52:14.772603989', '2011-05-28T11:02:14.772603989',
       '2011-05-28T11:12:14.772603989', '2011-05-28T11:22:14.772603989',
       '2011-05-28T11:32:14.772603989', '2011-05-28T11:42:14.772603989',
       '2011-05-28T11:52:14.772603989', '2011-05-28T12:02:14.772603989',
       '2011-05-28T12:12:14.772603989', '2011-05-28T12:22:14.772603989'],
      dtype='datetime64[ns]')
- ANTENNA1(baseline)int32dask.array<chunksize=(301,), meta=np.ndarray>
Array Chunk Bytes 3.53 kiB 1.18 kiB Shape (903,) (301,) Count 4 Tasks 3 Chunks Type int32 numpy.ndarray - ANTENNA2(baseline)int32dask.array<chunksize=(301,), meta=np.ndarray>
Array Chunk Bytes 3.53 kiB 1.18 kiB Shape (903,) (301,) Count 4 Tasks 3 Chunks Type int32 numpy.ndarray - ARRAY_ID(time, baseline)int32dask.array<chunksize=(32, 301), meta=np.ndarray>
Array Chunk Bytes 677.25 kiB 37.62 kiB Shape (192, 903) (32, 301) Count 19 Tasks 18 Chunks Type int32 numpy.ndarray - CORRECTED_DATA(time, baseline, chan, pol)complex128dask.array<chunksize=(32, 301, 1, 1), meta=np.ndarray>
Array Chunk Bytes 7.94 MiB 150.50 kiB Shape (192, 903, 3, 1) (32, 301, 1, 1) Count 55 Tasks 54 Chunks Type complex128 numpy.ndarray - CORRECTED_DATA_WEIGHT(time, baseline, chan, pol)float64dask.array<chunksize=(32, 301, 1, 1), meta=np.ndarray>
Array Chunk Bytes 3.97 MiB 75.25 kiB Shape (192, 903, 3, 1) (32, 301, 1, 1) Count 55 Tasks 54 Chunks Type float64 numpy.ndarray - DATA(time, baseline, chan, pol)complex128dask.array<chunksize=(32, 301, 1, 1), meta=np.ndarray>
Array Chunk Bytes 7.94 MiB 150.50 kiB Shape (192, 903, 3, 1) (32, 301, 1, 1) Count 55 Tasks 54 Chunks Type complex128 numpy.ndarray - DATA_WEIGHT(time, baseline, chan, pol)float64dask.array<chunksize=(32, 301, 1, 1), meta=np.ndarray>
Array Chunk Bytes 3.97 MiB 75.25 kiB Shape (192, 903, 3, 1) (32, 301, 1, 1) Count 55 Tasks 54 Chunks Type float64 numpy.ndarray - EXPOSURE(time, baseline)float64dask.array<chunksize=(32, 301), meta=np.ndarray>
Array Chunk Bytes 1.32 MiB 75.25 kiB Shape (192, 903) (32, 301) Count 19 Tasks 18 Chunks Type float64 numpy.ndarray - FEED1(time, baseline)int32dask.array<chunksize=(32, 301), meta=np.ndarray>
Array Chunk Bytes 677.25 kiB 37.62 kiB Shape (192, 903) (32, 301) Count 19 Tasks 18 Chunks Type int32 numpy.ndarray - FEED2(time, baseline)int32dask.array<chunksize=(32, 301), meta=np.ndarray>
Array Chunk Bytes 677.25 kiB 37.62 kiB Shape (192, 903) (32, 301) Count 19 Tasks 18 Chunks Type int32 numpy.ndarray - FIELD_ID(time, baseline)int32dask.array<chunksize=(32, 301), meta=np.ndarray>
Array Chunk Bytes 677.25 kiB 37.62 kiB Shape (192, 903) (32, 301) Count 19 Tasks 18 Chunks Type int32 numpy.ndarray - FLAG(time, baseline, chan, pol)booldask.array<chunksize=(32, 301, 1, 1), meta=np.ndarray>
Array Chunk Bytes 507.94 kiB 9.41 kiB Shape (192, 903, 3, 1) (32, 301, 1, 1) Count 55 Tasks 54 Chunks Type bool numpy.ndarray - INTERVAL(time, baseline)float64dask.array<chunksize=(32, 301), meta=np.ndarray>
Array Chunk Bytes 1.32 MiB 75.25 kiB Shape (192, 903) (32, 301) Count 19 Tasks 18 Chunks Type float64 numpy.ndarray - MODEL_DATA(time, baseline, chan, pol)complex128dask.array<chunksize=(32, 301, 1, 1), meta=np.ndarray>
Array Chunk Bytes 7.94 MiB 150.50 kiB Shape (192, 903, 3, 1) (32, 301, 1, 1) Count 55 Tasks 54 Chunks Type complex128 numpy.ndarray - OBSERVATION_ID(time, baseline)int32dask.array<chunksize=(32, 301), meta=np.ndarray>
Array Chunk Bytes 677.25 kiB 37.62 kiB Shape (192, 903) (32, 301) Count 19 Tasks 18 Chunks Type int32 numpy.ndarray - PROCESSOR_ID(time, baseline)int32dask.array<chunksize=(32, 301), meta=np.ndarray>
Array Chunk Bytes 677.25 kiB 37.62 kiB Shape (192, 903) (32, 301) Count 19 Tasks 18 Chunks Type int32 numpy.ndarray - SCAN_NUMBER(time, baseline)int32dask.array<chunksize=(32, 301), meta=np.ndarray>
Array Chunk Bytes 677.25 kiB 37.62 kiB Shape (192, 903) (32, 301) Count 19 Tasks 18 Chunks Type int32 numpy.ndarray - STATE_ID(time, baseline)int32dask.array<chunksize=(32, 301), meta=np.ndarray>
Array Chunk Bytes 677.25 kiB 37.62 kiB Shape (192, 903) (32, 301) Count 19 Tasks 18 Chunks Type int32 numpy.ndarray - TIME_CENTROID(time, baseline)float64dask.array<chunksize=(32, 301), meta=np.ndarray>
Array Chunk Bytes 1.32 MiB 75.25 kiB Shape (192, 903) (32, 301) Count 19 Tasks 18 Chunks Type float64 numpy.ndarray - UVW(time, baseline, uvw_index)float64dask.array<chunksize=(32, 301, 3), meta=np.ndarray>
Array Chunk Bytes 3.97 MiB 225.75 kiB Shape (192, 903, 3) (32, 301, 3) Count 19 Tasks 18 Chunks Type float64 numpy.ndarray
- corr_product :
- [[0, 0]]
- data_groups :
- [{'0': {'data': 'DATA', 'flag': 'FLAG', 'id': '0', 'uvw': 'UVW', 'weight': 'DATA_WEIGHT'}, '1': {'data': 'CORRECTED_DATA', 'flag': 'FLAG', 'id': '1', 'uvw': 'UVW', 'weight': 'CORRECTED_DATA_WEIGHT'}}]
- freq_group :
- 0
- freq_group_name :
- Group 1
- if_conv_chain :
- 0
- meas_freq_ref :
- 1
- name :
- Band_8
- net_sideband :
- 1
- num_chan :
- 3
- num_corr :
- 1
- ref_frequency :
- 340000000000.0
- total_bandwidth :
- 101999999999.99998
Grid Parameters
[5]:
grid_parms = {}
grid_parms['chan_mode'] = 'cube'
grid_parms['image_size'] = [1000,720]
grid_parms['cell_size'] = [0.04,0.04]
grid_parms['fft_padding'] = 1.0
grid_parms['phase_center'] = mxds.FIELD.PHASE_DIR[1,0,:].data.compute()
Direction Rotation
The UVW coordinates must be rotated and the visbility DATA must be phase rotated, relative to the mosaic phase center specified by rotation_parms['image_phase_center'].
direction_rotate documentation
[6]:
from ngcasa.imaging import direction_rotate
import numpy as np
import dask

xr.set_options(display_style="html")

infile = "alma12m_3field_dovpTrue.vis.zarr"
#DATA shape (192, 903, 3, 1), ZARR chunking (32, 301, 1, 1)
mxds = read_vis(infile,chunks={'time':192,'baseline':903,'chan':1})

sel_parms = {}
sel_parms['xds'] = 'xds0'

rotation_parms = {}
rotation_parms['new_phase_center'] = grid_parms['phase_center']
rotation_parms['common_tangent_reprojection'] = True
rotation_parms['single_precision'] = False

mxds = direction_rotate(mxds, rotation_parms, sel_parms)

mxds.xds0
overwrite_encoded_chunks True
######################### Start direction_rotate #########################
Setting default data_group_in  to  {'data': 'DATA', 'flag': 'FLAG', 'id': '0', 'uvw': 'UVW', 'weight': 'DATA_WEIGHT'}
Setting default data_group_out  to  {'data': 'DATA_ROT', 'flag': 'FLAG', 'id': '2', 'uvw': 'UVW_ROT', 'weight': 'DATA_WEIGHT'}
######################### Created graph for direction_rotate #########################
[6]:
<xarray.Dataset>
Dimensions:                (baseline: 903, chan: 3, pol: 1, pol_id: 1, spw_id: 1, time: 192, uvw_index: 3)
Coordinates:
  * baseline               (baseline) int64 0 1 2 3 4 5 ... 898 899 900 901 902
  * chan                   (chan) float64 3.4e+11 3.74e+11 4.08e+11
  * pol                    (pol) int32 9
  * time                   (time) datetime64[ns] 2011-05-27T04:32:14.77260398...
    chan_width             (chan) float64 dask.array<chunksize=(1,), meta=np.ndarray>
    effective_bw           (chan) float64 dask.array<chunksize=(1,), meta=np.ndarray>
  * pol_id                 (pol_id) int32 0
    resolution             (chan) float64 dask.array<chunksize=(1,), meta=np.ndarray>
  * spw_id                 (spw_id) int32 0
Dimensions without coordinates: uvw_index
Data variables: (12/22)
    ANTENNA1               (baseline) int32 dask.array<chunksize=(903,), meta=np.ndarray>
    ANTENNA2               (baseline) int32 dask.array<chunksize=(903,), meta=np.ndarray>
    ARRAY_ID               (time, baseline) int32 dask.array<chunksize=(192, 903), meta=np.ndarray>
    CORRECTED_DATA         (time, baseline, chan, pol) complex128 dask.array<chunksize=(192, 903, 1, 1), meta=np.ndarray>
    CORRECTED_DATA_WEIGHT  (time, baseline, chan, pol) float64 dask.array<chunksize=(192, 903, 1, 1), meta=np.ndarray>
    DATA                   (time, baseline, chan, pol) complex128 dask.array<chunksize=(192, 903, 1, 1), meta=np.ndarray>
    ...                     ...
    SCAN_NUMBER            (time, baseline) int32 dask.array<chunksize=(192, 903), meta=np.ndarray>
    STATE_ID               (time, baseline) int32 dask.array<chunksize=(192, 903), meta=np.ndarray>
    TIME_CENTROID          (time, baseline) float64 dask.array<chunksize=(192, 903), meta=np.ndarray>
    UVW                    (time, baseline, uvw_index) float64 dask.array<chunksize=(192, 903, 3), meta=np.ndarray>
    UVW_ROT                (time, baseline, uvw_index) float64 dask.array<chunksize=(192, 903, 3), meta=np.ndarray>
    DATA_ROT               (time, baseline, chan, pol) complex128 dask.array<chunksize=(192, 903, 1, 1), meta=np.ndarray>
Attributes:
    corr_product:     [[0, 0]]
    data_groups:      [{'0': {'data': 'DATA', 'flag': 'FLAG', 'id': '0', 'uvw...
    freq_group:       0
    freq_group_name:  Group 1
    if_conv_chain:    0
    meas_freq_ref:    1
    name:             Band_8
    net_sideband:     1
    num_chan:         3
    num_corr:         1
    ref_frequency:    340000000000.0
total_bandwidth: 101999999999.99998- baseline: 903
- chan: 3
- pol: 1
- pol_id: 1
- spw_id: 1
- time: 192
- uvw_index: 3
- baseline(baseline)int640 1 2 3 4 5 ... 898 899 900 901 902
array([ 0, 1, 2, ..., 900, 901, 902])
- chan(chan)float643.4e+11 3.74e+11 4.08e+11
array([3.40e+11, 3.74e+11, 4.08e+11])
- pol(pol)int329
array([9], dtype=int32)
- time(time)datetime64[ns]2011-05-27T04:32:14.772603989 .....
array(['2011-05-27T04:32:14.772603989', '2011-05-27T04:42:14.772603989', '2011-05-27T04:52:14.772603989', '2011-05-27T05:02:14.772603989', '2011-05-27T05:12:14.772603989', '2011-05-27T05:22:14.772603989', '2011-05-27T05:32:14.772603989', '2011-05-27T05:42:14.772603989', '2011-05-27T05:52:14.772603989', '2011-05-27T06:02:14.772603989', '2011-05-27T06:12:14.772603989', '2011-05-27T06:22:14.772603989', '2011-05-27T06:32:14.772603989', '2011-05-27T06:42:14.772603989', '2011-05-27T06:52:14.772603989', '2011-05-27T07:02:14.772603989', '2011-05-27T07:12:14.772603989', '2011-05-27T07:22:14.772603989', '2011-05-27T07:32:14.772603989', '2011-05-27T07:42:14.772603989', '2011-05-27T07:52:14.772603989', '2011-05-27T08:02:14.772603989', '2011-05-27T08:12:14.772603989', '2011-05-27T08:22:14.772603989', '2011-05-27T08:32:14.772603989', '2011-05-27T08:42:14.772603989', '2011-05-27T08:52:14.772603989', '2011-05-27T09:02:14.772603989', '2011-05-27T09:12:14.772603989', '2011-05-27T09:22:14.772603989', '2011-05-27T09:32:14.772603989', '2011-05-27T09:42:14.772603989', '2011-05-27T09:52:14.772603989', '2011-05-27T10:02:14.772603989', '2011-05-27T10:12:14.772603989', '2011-05-27T10:22:14.772603989', '2011-05-27T10:32:14.772603989', '2011-05-27T10:42:14.772603989', '2011-05-27T10:52:14.772603989', '2011-05-27T11:02:14.772603989', '2011-05-27T11:12:14.772603989', '2011-05-27T11:22:14.772603989', '2011-05-27T11:32:14.772603989', '2011-05-27T11:42:14.772603989', '2011-05-27T11:52:14.772603989', '2011-05-27T12:02:14.772603989', '2011-05-27T12:12:14.772603989', '2011-05-27T12:22:14.772603989', '2011-05-27T12:32:14.772603989', '2011-05-27T12:42:14.772603989', '2011-05-27T12:52:14.772603989', '2011-05-27T13:02:14.772603989', '2011-05-27T13:12:14.772603989', '2011-05-27T13:22:14.772603989', '2011-05-27T13:32:14.772603989', '2011-05-27T13:42:14.772603989', '2011-05-27T13:52:14.772603989', '2011-05-27T14:02:14.772603989', '2011-05-27T14:12:14.772603989', '2011-05-27T14:22:14.772603989', '2011-05-27T14:32:14.772603989', '2011-05-27T14:42:14.772603989', '2011-05-27T14:52:14.772603989', '2011-05-27T15:02:14.772603989', '2011-05-27T15:12:14.772603989', '2011-05-27T15:22:14.772603989', '2011-05-27T15:32:14.772603989', '2011-05-27T15:42:14.772603989', '2011-05-27T15:52:14.772603989', '2011-05-27T16:02:14.772603989', '2011-05-27T16:12:14.772603989', '2011-05-27T16:22:14.772603989', '2011-05-27T16:32:14.772603989', '2011-05-27T16:42:14.772603989', '2011-05-27T16:52:14.772603989', '2011-05-27T17:02:14.772603989', '2011-05-27T17:12:14.772603989', '2011-05-27T17:22:14.772603989', '2011-05-27T17:32:14.772603989', '2011-05-27T17:42:14.772603989', '2011-05-27T17:52:14.772603989', '2011-05-27T18:02:14.772603989', '2011-05-27T18:12:14.772603989', '2011-05-27T18:22:14.772603989', '2011-05-27T18:32:14.772603989', '2011-05-27T18:42:14.772603989', '2011-05-27T18:52:14.772603989', '2011-05-27T19:02:14.772603989', '2011-05-27T19:12:14.772603989', '2011-05-27T19:22:14.772603989', '2011-05-27T19:32:14.772603989', '2011-05-27T19:42:14.772603989', '2011-05-27T19:52:14.772603989', '2011-05-27T20:02:14.772603989', '2011-05-27T20:12:14.772603989', '2011-05-27T20:22:14.772603989', '2011-05-27T20:32:14.772603989', '2011-05-27T20:42:14.772603989', '2011-05-27T20:52:14.772603989', '2011-05-27T21:02:14.772603989', '2011-05-27T21:12:14.772603989', '2011-05-27T21:22:14.772603989', '2011-05-27T21:32:14.772603989', '2011-05-27T21:42:14.772603989', '2011-05-27T21:52:14.772603989', '2011-05-27T22:02:14.772603989', '2011-05-27T22:12:14.772603989', '2011-05-27T22:22:14.772603989', '2011-05-27T22:32:14.772603989', '2011-05-27T22:42:14.772603989', '2011-05-27T22:52:14.772603989', '2011-05-27T23:02:14.772603989', '2011-05-27T23:12:14.772603989', '2011-05-27T23:22:14.772603989', '2011-05-27T23:32:14.772603989', '2011-05-27T23:42:14.772603989', '2011-05-27T23:52:14.772603989', '2011-05-28T00:02:14.772603989', '2011-05-28T00:12:14.772603989', '2011-05-28T00:22:14.772603989', '2011-05-28T00:32:14.772603989', '2011-05-28T00:42:14.772603989', '2011-05-28T00:52:14.772603989', '2011-05-28T01:02:14.772603989', '2011-05-28T01:12:14.772603989', '2011-05-28T01:22:14.772603989', '2011-05-28T01:32:14.772603989', '2011-05-28T01:42:14.772603989', '2011-05-28T01:52:14.772603989', '2011-05-28T02:02:14.772603989', '2011-05-28T02:12:14.772603989', '2011-05-28T02:22:14.772603989', '2011-05-28T02:32:14.772603989', '2011-05-28T02:42:14.772603989', '2011-05-28T02:52:14.772603989', '2011-05-28T03:02:14.772603989', '2011-05-28T03:12:14.772603989', '2011-05-28T03:22:14.772603989', '2011-05-28T03:32:14.772603989', '2011-05-28T03:42:14.772603989', '2011-05-28T03:52:14.772603989', '2011-05-28T04:02:14.772603989', '2011-05-28T04:12:14.772603989', '2011-05-28T04:22:14.772603989', '2011-05-28T04:32:14.772603989', '2011-05-28T04:42:14.772603989', '2011-05-28T04:52:14.772603989', '2011-05-28T05:02:14.772603989', '2011-05-28T05:12:14.772603989', '2011-05-28T05:22:14.772603989', '2011-05-28T05:32:14.772603989', '2011-05-28T05:42:14.772603989', '2011-05-28T05:52:14.772603989', '2011-05-28T06:02:14.772603989', '2011-05-28T06:12:14.772603989', '2011-05-28T06:22:14.772603989', '2011-05-28T06:32:14.772603989', '2011-05-28T06:42:14.772603989', '2011-05-28T06:52:14.772603989', '2011-05-28T07:02:14.772603989', '2011-05-28T07:12:14.772603989', '2011-05-28T07:22:14.772603989', '2011-05-28T07:32:14.772603989', '2011-05-28T07:42:14.772603989', '2011-05-28T07:52:14.772603989', '2011-05-28T08:02:14.772603989', '2011-05-28T08:12:14.772603989', '2011-05-28T08:22:14.772603989', '2011-05-28T08:32:14.772603989', '2011-05-28T08:42:14.772603989', '2011-05-28T08:52:14.772603989', '2011-05-28T09:02:14.772603989', '2011-05-28T09:12:14.772603989', '2011-05-28T09:22:14.772603989', '2011-05-28T09:32:14.772603989', '2011-05-28T09:42:14.772603989', '2011-05-28T09:52:14.772603989', '2011-05-28T10:02:14.772603989', '2011-05-28T10:12:14.772603989', '2011-05-28T10:22:14.772603989', '2011-05-28T10:32:14.772603989', '2011-05-28T10:42:14.772603989', '2011-05-28T10:52:14.772603989', '2011-05-28T11:02:14.772603989', '2011-05-28T11:12:14.772603989', '2011-05-28T11:22:14.772603989', '2011-05-28T11:32:14.772603989', '2011-05-28T11:42:14.772603989', '2011-05-28T11:52:14.772603989', '2011-05-28T12:02:14.772603989', '2011-05-28T12:12:14.772603989', '2011-05-28T12:22:14.772603989'], dtype='datetime64[ns]') - chan_width(chan)float64dask.array<chunksize=(1,), meta=np.ndarray>
Array Chunk Bytes 24 B 8 B Shape (3,) (1,) Count 4 Tasks 3 Chunks Type float64 numpy.ndarray - effective_bw(chan)float64dask.array<chunksize=(1,), meta=np.ndarray>
Array Chunk Bytes 24 B 8 B Shape (3,) (1,) Count 4 Tasks 3 Chunks Type float64 numpy.ndarray - pol_id(pol_id)int320
array([0], dtype=int32)
- resolution(chan)float64dask.array<chunksize=(1,), meta=np.ndarray>
Array Chunk Bytes 24 B 8 B Shape (3,) (1,) Count 4 Tasks 3 Chunks Type float64 numpy.ndarray - spw_id(spw_id)int320
array([0], dtype=int32)
- ANTENNA1(baseline)int32dask.array<chunksize=(903,), meta=np.ndarray>
Array Chunk Bytes 3.53 kiB 3.53 kiB Shape (903,) (903,) Count 3 Tasks 1 Chunks Type int32 numpy.ndarray - ANTENNA2(baseline)int32dask.array<chunksize=(903,), meta=np.ndarray>
Array Chunk Bytes 3.53 kiB 3.53 kiB Shape (903,) (903,) Count 3 Tasks 1 Chunks Type int32 numpy.ndarray - ARRAY_ID(time, baseline)int32dask.array<chunksize=(192, 903), meta=np.ndarray>
Array Chunk Bytes 677.25 kiB 677.25 kiB Shape (192, 903) (192, 903) Count 3 Tasks 1 Chunks Type int32 numpy.ndarray - CORRECTED_DATA(time, baseline, chan, pol)complex128dask.array<chunksize=(192, 903, 1, 1), meta=np.ndarray>
Array Chunk Bytes 7.94 MiB 2.65 MiB Shape (192, 903, 3, 1) (192, 903, 1, 1) Count 4 Tasks 3 Chunks Type complex128 numpy.ndarray - CORRECTED_DATA_WEIGHT(time, baseline, chan, pol)float64dask.array<chunksize=(192, 903, 1, 1), meta=np.ndarray>
Array Chunk Bytes 3.97 MiB 1.32 MiB Shape (192, 903, 3, 1) (192, 903, 1, 1) Count 4 Tasks 3 Chunks Type float64 numpy.ndarray - DATA(time, baseline, chan, pol)complex128dask.array<chunksize=(192, 903, 1, 1), meta=np.ndarray>
Array Chunk Bytes 7.94 MiB 2.65 MiB Shape (192, 903, 3, 1) (192, 903, 1, 1) Count 4 Tasks 3 Chunks Type complex128 numpy.ndarray - DATA_WEIGHT(time, baseline, chan, pol)float64dask.array<chunksize=(192, 903, 1, 1), meta=np.ndarray>
Array Chunk Bytes 3.97 MiB 1.32 MiB Shape (192, 903, 3, 1) (192, 903, 1, 1) Count 4 Tasks 3 Chunks Type float64 numpy.ndarray - EXPOSURE(time, baseline)float64dask.array<chunksize=(192, 903), meta=np.ndarray>
Array Chunk Bytes 1.32 MiB 1.32 MiB Shape (192, 903) (192, 903) Count 3 Tasks 1 Chunks Type float64 numpy.ndarray - FEED1(time, baseline)int32dask.array<chunksize=(192, 903), meta=np.ndarray>
Array Chunk Bytes 677.25 kiB 677.25 kiB Shape (192, 903) (192, 903) Count 3 Tasks 1 Chunks Type int32 numpy.ndarray - FEED2(time, baseline)int32dask.array<chunksize=(192, 903), meta=np.ndarray>
Array Chunk Bytes 677.25 kiB 677.25 kiB Shape (192, 903) (192, 903) Count 3 Tasks 1 Chunks Type int32 numpy.ndarray - FIELD_ID(time, baseline)int32dask.array<chunksize=(192, 903), meta=np.ndarray>
Array Chunk Bytes 677.25 kiB 677.25 kiB Shape (192, 903) (192, 903) Count 3 Tasks 1 Chunks Type int32 numpy.ndarray - FLAG(time, baseline, chan, pol)booldask.array<chunksize=(192, 903, 1, 1), meta=np.ndarray>
Array Chunk Bytes 507.94 kiB 169.31 kiB Shape (192, 903, 3, 1) (192, 903, 1, 1) Count 4 Tasks 3 Chunks Type bool numpy.ndarray - INTERVAL(time, baseline)float64dask.array<chunksize=(192, 903), meta=np.ndarray>
Array Chunk Bytes 1.32 MiB 1.32 MiB Shape (192, 903) (192, 903) Count 3 Tasks 1 Chunks Type float64 numpy.ndarray - MODEL_DATA(time, baseline, chan, pol)complex128dask.array<chunksize=(192, 903, 1, 1), meta=np.ndarray>
Array Chunk Bytes 7.94 MiB 2.65 MiB Shape (192, 903, 3, 1) (192, 903, 1, 1) Count 4 Tasks 3 Chunks Type complex128 numpy.ndarray - OBSERVATION_ID(time, baseline)int32dask.array<chunksize=(192, 903), meta=np.ndarray>
Array Chunk Bytes 677.25 kiB 677.25 kiB Shape (192, 903) (192, 903) Count 3 Tasks 1 Chunks Type int32 numpy.ndarray - PROCESSOR_ID(time, baseline)int32dask.array<chunksize=(192, 903), meta=np.ndarray>
Array Chunk Bytes 677.25 kiB 677.25 kiB Shape (192, 903) (192, 903) Count 3 Tasks 1 Chunks Type int32 numpy.ndarray - SCAN_NUMBER(time, baseline)int32dask.array<chunksize=(192, 903), meta=np.ndarray>
Array Chunk Bytes 677.25 kiB 677.25 kiB Shape (192, 903) (192, 903) Count 3 Tasks 1 Chunks Type int32 numpy.ndarray - STATE_ID(time, baseline)int32dask.array<chunksize=(192, 903), meta=np.ndarray>
Array Chunk Bytes 677.25 kiB 677.25 kiB Shape (192, 903) (192, 903) Count 3 Tasks 1 Chunks Type int32 numpy.ndarray - TIME_CENTROID(time, baseline)float64dask.array<chunksize=(192, 903), meta=np.ndarray>
Array Chunk Bytes 1.32 MiB 1.32 MiB Shape (192, 903) (192, 903) Count 3 Tasks 1 Chunks Type float64 numpy.ndarray - UVW(time, baseline, uvw_index)float64dask.array<chunksize=(192, 903, 3), meta=np.ndarray>
Array Chunk Bytes 3.97 MiB 3.97 MiB Shape (192, 903, 3) (192, 903, 3) Count 3 Tasks 1 Chunks Type float64 numpy.ndarray - UVW_ROT(time, baseline, uvw_index)float64dask.array<chunksize=(192, 903, 3), meta=np.ndarray>
Array Chunk Bytes 3.97 MiB 3.97 MiB Shape (192, 903, 3) (192, 903, 3) Count 8 Tasks 1 Chunks Type float64 numpy.ndarray - DATA_ROT(time, baseline, chan, pol)complex128dask.array<chunksize=(192, 903, 1, 1), meta=np.ndarray>
Array Chunk Bytes 7.94 MiB 2.65 MiB Shape (192, 903, 3, 1) (192, 903, 1, 1) Count 23 Tasks 3 Chunks Type complex128 numpy.ndarray
- corr_product :
- [[0, 0]]
- data_groups :
- [{'0': {'data': 'DATA', 'flag': 'FLAG', 'id': '0', 'uvw': 'UVW', 'weight': 'DATA_WEIGHT'}, '1': {'data': 'CORRECTED_DATA', 'flag': 'FLAG', 'id': '1', 'uvw': 'UVW', 'weight': 'CORRECTED_DATA_WEIGHT'}, '2': {'data': 'DATA_ROT', 'flag': 'FLAG', 'id': '2', 'uvw': 'UVW_ROT', 'weight': 'DATA_WEIGHT'}}]
- freq_group :
- 0
- freq_group_name :
- Group 1
- if_conv_chain :
- 0
- meas_freq_ref :
- 1
- name :
- Band_8
- net_sideband :
- 1
- num_chan :
- 3
- num_corr :
- 1
- ref_frequency :
- 340000000000.0
- total_bandwidth :
- 101999999999.99998
Make Imaging Weights
make_imaging_weight documentation
[7]:
from ngcasa.imaging import make_imaging_weight

imaging_weights_parms = {}
imaging_weights_parms['weighting'] = 'natural'

sel_parms = {}
sel_parms['xds'] = 'xds0'
sel_parms['data_group_in_id'] = 2

mxds = make_imaging_weight(mxds, imaging_weights_parms, grid_parms, sel_parms)

imaging_weights_parms = {}
imaging_weights_parms['weighting'] = 'natural'

sel_parms = {}
sel_parms['xds'] = 'xds0'
sel_parms['data_group_in_id'] = 0

mxds = make_imaging_weight(mxds, imaging_weights_parms, grid_parms, sel_parms)
mxds.xds0
######################### Start make_imaging_weights #########################
Setting data_group_in  to  {'data': 'DATA_ROT', 'flag': 'FLAG', 'id': '2', 'uvw': 'UVW_ROT', 'weight': 'DATA_WEIGHT'}
Setting default data_group_out  to  {'data': 'DATA_ROT', 'flag': 'FLAG', 'id': '2', 'uvw': 'UVW_ROT', 'weight': 'DATA_WEIGHT', 'imaging_weight': 'IMAGING_WEIGHT'}
Since weighting is natural input weight will be reused as imaging weight.
######################### Created graph for make_imaging_weight #########################
######################### Start make_imaging_weights #########################
Setting data_group_in  to  {'data': 'DATA', 'flag': 'FLAG', 'id': '0', 'uvw': 'UVW', 'weight': 'DATA_WEIGHT'}
Setting default data_group_out  to  {'data': 'DATA', 'flag': 'FLAG', 'id': '0', 'uvw': 'UVW', 'weight': 'DATA_WEIGHT', 'imaging_weight': 'IMAGING_WEIGHT'}
Since weighting is natural input weight will be reused as imaging weight.
######################### Created graph for make_imaging_weight #########################
[7]:
<xarray.Dataset>
Dimensions:                (baseline: 903, chan: 3, pol: 1, pol_id: 1, spw_id: 1, time: 192, uvw_index: 3)
Coordinates:
  * baseline               (baseline) int64 0 1 2 3 4 5 ... 898 899 900 901 902
  * chan                   (chan) float64 3.4e+11 3.74e+11 4.08e+11
  * pol                    (pol) int32 9
  * time                   (time) datetime64[ns] 2011-05-27T04:32:14.77260398...
    chan_width             (chan) float64 dask.array<chunksize=(1,), meta=np.ndarray>
    effective_bw           (chan) float64 dask.array<chunksize=(1,), meta=np.ndarray>
  * pol_id                 (pol_id) int32 0
    resolution             (chan) float64 dask.array<chunksize=(1,), meta=np.ndarray>
  * spw_id                 (spw_id) int32 0
Dimensions without coordinates: uvw_index
Data variables: (12/22)
    ANTENNA1               (baseline) int32 dask.array<chunksize=(903,), meta=np.ndarray>
    ANTENNA2               (baseline) int32 dask.array<chunksize=(903,), meta=np.ndarray>
    ARRAY_ID               (time, baseline) int32 dask.array<chunksize=(192, 903), meta=np.ndarray>
    CORRECTED_DATA         (time, baseline, chan, pol) complex128 dask.array<chunksize=(192, 903, 1, 1), meta=np.ndarray>
    CORRECTED_DATA_WEIGHT  (time, baseline, chan, pol) float64 dask.array<chunksize=(192, 903, 1, 1), meta=np.ndarray>
    DATA                   (time, baseline, chan, pol) complex128 dask.array<chunksize=(192, 903, 1, 1), meta=np.ndarray>
    ...                     ...
    SCAN_NUMBER            (time, baseline) int32 dask.array<chunksize=(192, 903), meta=np.ndarray>
    STATE_ID               (time, baseline) int32 dask.array<chunksize=(192, 903), meta=np.ndarray>
    TIME_CENTROID          (time, baseline) float64 dask.array<chunksize=(192, 903), meta=np.ndarray>
    UVW                    (time, baseline, uvw_index) float64 dask.array<chunksize=(192, 903, 3), meta=np.ndarray>
    UVW_ROT                (time, baseline, uvw_index) float64 dask.array<chunksize=(192, 903, 3), meta=np.ndarray>
    DATA_ROT               (time, baseline, chan, pol) complex128 dask.array<chunksize=(192, 903, 1, 1), meta=np.ndarray>
Attributes:
    corr_product:     [[0, 0]]
    data_groups:      [{'0': {'data': 'DATA', 'flag': 'FLAG', 'id': '0', 'uvw...
    freq_group:       0
    freq_group_name:  Group 1
    if_conv_chain:    0
    meas_freq_ref:    1
    name:             Band_8
    net_sideband:     1
    num_chan:         3
    num_corr:         1
    ref_frequency:    340000000000.0
total_bandwidth: 101999999999.99998- baseline: 903
- chan: 3
- pol: 1
- pol_id: 1
- spw_id: 1
- time: 192
- uvw_index: 3
- baseline(baseline)int640 1 2 3 4 5 ... 898 899 900 901 902
array([ 0, 1, 2, ..., 900, 901, 902])
- chan(chan)float643.4e+11 3.74e+11 4.08e+11
array([3.40e+11, 3.74e+11, 4.08e+11])
- pol(pol)int329
array([9], dtype=int32)
- time(time)datetime64[ns]2011-05-27T04:32:14.772603989 .....
array(['2011-05-27T04:32:14.772603989', '2011-05-27T04:42:14.772603989', '2011-05-27T04:52:14.772603989', '2011-05-27T05:02:14.772603989', '2011-05-27T05:12:14.772603989', '2011-05-27T05:22:14.772603989', '2011-05-27T05:32:14.772603989', '2011-05-27T05:42:14.772603989', '2011-05-27T05:52:14.772603989', '2011-05-27T06:02:14.772603989', '2011-05-27T06:12:14.772603989', '2011-05-27T06:22:14.772603989', '2011-05-27T06:32:14.772603989', '2011-05-27T06:42:14.772603989', '2011-05-27T06:52:14.772603989', '2011-05-27T07:02:14.772603989', '2011-05-27T07:12:14.772603989', '2011-05-27T07:22:14.772603989', '2011-05-27T07:32:14.772603989', '2011-05-27T07:42:14.772603989', '2011-05-27T07:52:14.772603989', '2011-05-27T08:02:14.772603989', '2011-05-27T08:12:14.772603989', '2011-05-27T08:22:14.772603989', '2011-05-27T08:32:14.772603989', '2011-05-27T08:42:14.772603989', '2011-05-27T08:52:14.772603989', '2011-05-27T09:02:14.772603989', '2011-05-27T09:12:14.772603989', '2011-05-27T09:22:14.772603989', '2011-05-27T09:32:14.772603989', '2011-05-27T09:42:14.772603989', '2011-05-27T09:52:14.772603989', '2011-05-27T10:02:14.772603989', '2011-05-27T10:12:14.772603989', '2011-05-27T10:22:14.772603989', '2011-05-27T10:32:14.772603989', '2011-05-27T10:42:14.772603989', '2011-05-27T10:52:14.772603989', '2011-05-27T11:02:14.772603989', '2011-05-27T11:12:14.772603989', '2011-05-27T11:22:14.772603989', '2011-05-27T11:32:14.772603989', '2011-05-27T11:42:14.772603989', '2011-05-27T11:52:14.772603989', '2011-05-27T12:02:14.772603989', '2011-05-27T12:12:14.772603989', '2011-05-27T12:22:14.772603989', '2011-05-27T12:32:14.772603989', '2011-05-27T12:42:14.772603989', '2011-05-27T12:52:14.772603989', '2011-05-27T13:02:14.772603989', '2011-05-27T13:12:14.772603989', '2011-05-27T13:22:14.772603989', '2011-05-27T13:32:14.772603989', '2011-05-27T13:42:14.772603989', '2011-05-27T13:52:14.772603989', '2011-05-27T14:02:14.772603989', '2011-05-27T14:12:14.772603989', '2011-05-27T14:22:14.772603989', '2011-05-27T14:32:14.772603989', '2011-05-27T14:42:14.772603989', '2011-05-27T14:52:14.772603989', '2011-05-27T15:02:14.772603989', '2011-05-27T15:12:14.772603989', '2011-05-27T15:22:14.772603989', '2011-05-27T15:32:14.772603989', '2011-05-27T15:42:14.772603989', '2011-05-27T15:52:14.772603989', '2011-05-27T16:02:14.772603989', '2011-05-27T16:12:14.772603989', '2011-05-27T16:22:14.772603989', '2011-05-27T16:32:14.772603989', '2011-05-27T16:42:14.772603989', '2011-05-27T16:52:14.772603989', '2011-05-27T17:02:14.772603989', '2011-05-27T17:12:14.772603989', '2011-05-27T17:22:14.772603989', '2011-05-27T17:32:14.772603989', '2011-05-27T17:42:14.772603989', '2011-05-27T17:52:14.772603989', '2011-05-27T18:02:14.772603989', '2011-05-27T18:12:14.772603989', '2011-05-27T18:22:14.772603989', '2011-05-27T18:32:14.772603989', '2011-05-27T18:42:14.772603989', '2011-05-27T18:52:14.772603989', '2011-05-27T19:02:14.772603989', '2011-05-27T19:12:14.772603989', '2011-05-27T19:22:14.772603989', '2011-05-27T19:32:14.772603989', '2011-05-27T19:42:14.772603989', '2011-05-27T19:52:14.772603989', '2011-05-27T20:02:14.772603989', '2011-05-27T20:12:14.772603989', '2011-05-27T20:22:14.772603989', '2011-05-27T20:32:14.772603989', '2011-05-27T20:42:14.772603989', '2011-05-27T20:52:14.772603989', '2011-05-27T21:02:14.772603989', '2011-05-27T21:12:14.772603989', '2011-05-27T21:22:14.772603989', '2011-05-27T21:32:14.772603989', '2011-05-27T21:42:14.772603989', '2011-05-27T21:52:14.772603989', '2011-05-27T22:02:14.772603989', '2011-05-27T22:12:14.772603989', '2011-05-27T22:22:14.772603989', '2011-05-27T22:32:14.772603989', '2011-05-27T22:42:14.772603989', '2011-05-27T22:52:14.772603989', '2011-05-27T23:02:14.772603989', '2011-05-27T23:12:14.772603989', '2011-05-27T23:22:14.772603989', '2011-05-27T23:32:14.772603989', '2011-05-27T23:42:14.772603989', '2011-05-27T23:52:14.772603989', '2011-05-28T00:02:14.772603989', '2011-05-28T00:12:14.772603989', '2011-05-28T00:22:14.772603989', '2011-05-28T00:32:14.772603989', '2011-05-28T00:42:14.772603989', '2011-05-28T00:52:14.772603989', '2011-05-28T01:02:14.772603989', '2011-05-28T01:12:14.772603989', '2011-05-28T01:22:14.772603989', '2011-05-28T01:32:14.772603989', '2011-05-28T01:42:14.772603989', '2011-05-28T01:52:14.772603989', '2011-05-28T02:02:14.772603989', '2011-05-28T02:12:14.772603989', '2011-05-28T02:22:14.772603989', '2011-05-28T02:32:14.772603989', '2011-05-28T02:42:14.772603989', '2011-05-28T02:52:14.772603989', '2011-05-28T03:02:14.772603989', '2011-05-28T03:12:14.772603989', '2011-05-28T03:22:14.772603989', '2011-05-28T03:32:14.772603989', '2011-05-28T03:42:14.772603989', '2011-05-28T03:52:14.772603989', '2011-05-28T04:02:14.772603989', '2011-05-28T04:12:14.772603989', '2011-05-28T04:22:14.772603989', '2011-05-28T04:32:14.772603989', '2011-05-28T04:42:14.772603989', '2011-05-28T04:52:14.772603989', '2011-05-28T05:02:14.772603989', '2011-05-28T05:12:14.772603989', '2011-05-28T05:22:14.772603989', '2011-05-28T05:32:14.772603989', '2011-05-28T05:42:14.772603989', '2011-05-28T05:52:14.772603989', '2011-05-28T06:02:14.772603989', '2011-05-28T06:12:14.772603989', '2011-05-28T06:22:14.772603989', '2011-05-28T06:32:14.772603989', '2011-05-28T06:42:14.772603989', '2011-05-28T06:52:14.772603989', '2011-05-28T07:02:14.772603989', '2011-05-28T07:12:14.772603989', '2011-05-28T07:22:14.772603989', '2011-05-28T07:32:14.772603989', '2011-05-28T07:42:14.772603989', '2011-05-28T07:52:14.772603989', '2011-05-28T08:02:14.772603989', '2011-05-28T08:12:14.772603989', '2011-05-28T08:22:14.772603989', '2011-05-28T08:32:14.772603989', '2011-05-28T08:42:14.772603989', '2011-05-28T08:52:14.772603989', '2011-05-28T09:02:14.772603989', '2011-05-28T09:12:14.772603989', '2011-05-28T09:22:14.772603989', '2011-05-28T09:32:14.772603989', '2011-05-28T09:42:14.772603989', '2011-05-28T09:52:14.772603989', '2011-05-28T10:02:14.772603989', '2011-05-28T10:12:14.772603989', '2011-05-28T10:22:14.772603989', '2011-05-28T10:32:14.772603989', '2011-05-28T10:42:14.772603989', '2011-05-28T10:52:14.772603989', '2011-05-28T11:02:14.772603989', '2011-05-28T11:12:14.772603989', '2011-05-28T11:22:14.772603989', '2011-05-28T11:32:14.772603989', '2011-05-28T11:42:14.772603989', '2011-05-28T11:52:14.772603989', '2011-05-28T12:02:14.772603989', '2011-05-28T12:12:14.772603989', '2011-05-28T12:22:14.772603989'], dtype='datetime64[ns]') - chan_width(chan)float64dask.array<chunksize=(1,), meta=np.ndarray>
Array Chunk Bytes 24 B 8 B Shape (3,) (1,) Count 4 Tasks 3 Chunks Type float64 numpy.ndarray - effective_bw(chan)float64dask.array<chunksize=(1,), meta=np.ndarray>
Array Chunk Bytes 24 B 8 B Shape (3,) (1,) Count 4 Tasks 3 Chunks Type float64 numpy.ndarray - pol_id(pol_id)int320
array([0], dtype=int32)
- resolution(chan)float64dask.array<chunksize=(1,), meta=np.ndarray>
Array Chunk Bytes 24 B 8 B Shape (3,) (1,) Count 4 Tasks 3 Chunks Type float64 numpy.ndarray - spw_id(spw_id)int320
array([0], dtype=int32)
- ANTENNA1(baseline)int32dask.array<chunksize=(903,), meta=np.ndarray>
Array Chunk Bytes 3.53 kiB 3.53 kiB Shape (903,) (903,) Count 5 Tasks 1 Chunks Type int32 numpy.ndarray - ANTENNA2(baseline)int32dask.array<chunksize=(903,), meta=np.ndarray>
Array Chunk Bytes 3.53 kiB 3.53 kiB Shape (903,) (903,) Count 5 Tasks 1 Chunks Type int32 numpy.ndarray - ARRAY_ID(time, baseline)int32dask.array<chunksize=(192, 903), meta=np.ndarray>
Array Chunk Bytes 677.25 kiB 677.25 kiB Shape (192, 903) (192, 903) Count 5 Tasks 1 Chunks Type int32 numpy.ndarray - CORRECTED_DATA(time, baseline, chan, pol)complex128dask.array<chunksize=(192, 903, 1, 1), meta=np.ndarray>
Array Chunk Bytes 7.94 MiB 2.65 MiB Shape (192, 903, 3, 1) (192, 903, 1, 1) Count 4 Tasks 3 Chunks Type complex128 numpy.ndarray - CORRECTED_DATA_WEIGHT(time, baseline, chan, pol)float64dask.array<chunksize=(192, 903, 1, 1), meta=np.ndarray>
Array Chunk Bytes 3.97 MiB 1.32 MiB Shape (192, 903, 3, 1) (192, 903, 1, 1) Count 4 Tasks 3 Chunks Type float64 numpy.ndarray - DATA(time, baseline, chan, pol)complex128dask.array<chunksize=(192, 903, 1, 1), meta=np.ndarray>
Array Chunk Bytes 7.94 MiB 2.65 MiB Shape (192, 903, 3, 1) (192, 903, 1, 1) Count 4 Tasks 3 Chunks Type complex128 numpy.ndarray - DATA_WEIGHT(time, baseline, chan, pol)float64dask.array<chunksize=(192, 903, 1, 1), meta=np.ndarray>
Array Chunk Bytes 3.97 MiB 1.32 MiB Shape (192, 903, 3, 1) (192, 903, 1, 1) Count 4 Tasks 3 Chunks Type float64 numpy.ndarray - EXPOSURE(time, baseline)float64dask.array<chunksize=(192, 903), meta=np.ndarray>
Array Chunk Bytes 1.32 MiB 1.32 MiB Shape (192, 903) (192, 903) Count 5 Tasks 1 Chunks Type float64 numpy.ndarray - FEED1(time, baseline)int32dask.array<chunksize=(192, 903), meta=np.ndarray>
Array Chunk Bytes 677.25 kiB 677.25 kiB Shape (192, 903) (192, 903) Count 5 Tasks 1 Chunks Type int32 numpy.ndarray - FEED2(time, baseline)int32dask.array<chunksize=(192, 903), meta=np.ndarray>
Array Chunk Bytes 677.25 kiB 677.25 kiB Shape (192, 903) (192, 903) Count 5 Tasks 1 Chunks Type int32 numpy.ndarray - FIELD_ID(time, baseline)int32dask.array<chunksize=(192, 903), meta=np.ndarray>
Array Chunk Bytes 677.25 kiB 677.25 kiB Shape (192, 903) (192, 903) Count 5 Tasks 1 Chunks Type int32 numpy.ndarray - FLAG(time, baseline, chan, pol)booldask.array<chunksize=(192, 903, 1, 1), meta=np.ndarray>
Array Chunk Bytes 507.94 kiB 169.31 kiB Shape (192, 903, 3, 1) (192, 903, 1, 1) Count 4 Tasks 3 Chunks Type bool numpy.ndarray - INTERVAL(time, baseline)float64dask.array<chunksize=(192, 903), meta=np.ndarray>
Array Chunk Bytes 1.32 MiB 1.32 MiB Shape (192, 903) (192, 903) Count 5 Tasks 1 Chunks Type float64 numpy.ndarray - MODEL_DATA(time, baseline, chan, pol)complex128dask.array<chunksize=(192, 903, 1, 1), meta=np.ndarray>
Array Chunk Bytes 7.94 MiB 2.65 MiB Shape (192, 903, 3, 1) (192, 903, 1, 1) Count 4 Tasks 3 Chunks Type complex128 numpy.ndarray - OBSERVATION_ID(time, baseline)int32dask.array<chunksize=(192, 903), meta=np.ndarray>
Array Chunk Bytes 677.25 kiB 677.25 kiB Shape (192, 903) (192, 903) Count 5 Tasks 1 Chunks Type int32 numpy.ndarray - PROCESSOR_ID(time, baseline)int32dask.array<chunksize=(192, 903), meta=np.ndarray>
Array Chunk Bytes 677.25 kiB 677.25 kiB Shape (192, 903) (192, 903) Count 5 Tasks 1 Chunks Type int32 numpy.ndarray - SCAN_NUMBER(time, baseline)int32dask.array<chunksize=(192, 903), meta=np.ndarray>
Array Chunk Bytes 677.25 kiB 677.25 kiB Shape (192, 903) (192, 903) Count 5 Tasks 1 Chunks Type int32 numpy.ndarray - STATE_ID(time, baseline)int32dask.array<chunksize=(192, 903), meta=np.ndarray>
Array Chunk Bytes 677.25 kiB 677.25 kiB Shape (192, 903) (192, 903) Count 5 Tasks 1 Chunks Type int32 numpy.ndarray - TIME_CENTROID(time, baseline)float64dask.array<chunksize=(192, 903), meta=np.ndarray>
Array Chunk Bytes 1.32 MiB 1.32 MiB Shape (192, 903) (192, 903) Count 5 Tasks 1 Chunks Type float64 numpy.ndarray - UVW(time, baseline, uvw_index)float64dask.array<chunksize=(192, 903, 3), meta=np.ndarray>
Array Chunk Bytes 3.97 MiB 3.97 MiB Shape (192, 903, 3) (192, 903, 3) Count 5 Tasks 1 Chunks Type float64 numpy.ndarray - UVW_ROT(time, baseline, uvw_index)float64dask.array<chunksize=(192, 903, 3), meta=np.ndarray>
Array Chunk Bytes 3.97 MiB 3.97 MiB Shape (192, 903, 3) (192, 903, 3) Count 10 Tasks 1 Chunks Type float64 numpy.ndarray - DATA_ROT(time, baseline, chan, pol)complex128dask.array<chunksize=(192, 903, 1, 1), meta=np.ndarray>
Array Chunk Bytes 7.94 MiB 2.65 MiB Shape (192, 903, 3, 1) (192, 903, 1, 1) Count 23 Tasks 3 Chunks Type complex128 numpy.ndarray
- corr_product :
- [[0, 0]]
- data_groups :
- [{'0': {'data': 'DATA', 'flag': 'FLAG', 'id': '0', 'uvw': 'UVW', 'weight': 'DATA_WEIGHT', 'imaging_weight': 'DATA_WEIGHT'}, '1': {'data': 'CORRECTED_DATA', 'flag': 'FLAG', 'id': '1', 'uvw': 'UVW', 'weight': 'CORRECTED_DATA_WEIGHT'}, '2': {'data': 'DATA_ROT', 'flag': 'FLAG', 'id': '2', 'uvw': 'UVW_ROT', 'weight': 'DATA_WEIGHT', 'imaging_weight': 'DATA_WEIGHT'}}]
- freq_group :
- 0
- freq_group_name :
- Group 1
- if_conv_chain :
- 0
- meas_freq_ref :
- 1
- name :
- Band_8
- net_sideband :
- 1
- num_chan :
- 3
- num_corr :
- 1
- ref_frequency :
- 340000000000.0
- total_bandwidth :
- 101999999999.99998
Make Gridding Convolution Functions
make_gridding_convolution_function
[8]:
from ngcasa.imaging import make_gridding_convolution_function
import numpy as np
import dask.array as da
from cngi.dio import write_image

gcf_parms = {}
gcf_parms['function'] = 'casa_airy'
gcf_parms['list_dish_diameters'] = np.array([10.7])
gcf_parms['list_blockage_diameters'] = np.array([0.75])

unique_ant_indx = mxds.ANTENNA.DISH_DIAMETER.values
unique_ant_indx[unique_ant_indx == 12.0] = 0

gcf_parms['unique_ant_indx'] = unique_ant_indx.astype(int)
gcf_parms['phase_center'] = grid_parms['phase_center']

sel_parms = {}
sel_parms['xds'] = 'xds0'
sel_parms['data_group_in_id'] = 2

gcf_xds = make_gridding_convolution_function(mxds, gcf_parms, grid_parms, sel_parms)
write_image(gcf_xds,'mosaic_gcf.gcf.zarr')
gcf_xds = xr.open_zarr('mosaic_gcf.gcf.zarr')
gcf_xds
######################### Start make_gridding_convolution_function #########################
Setting data_group_in  to  {'data': 'DATA_ROT', 'flag': 'FLAG', 'id': '2', 'uvw': 'UVW_ROT', 'weight': 'DATA_WEIGHT', 'imaging_weight': 'DATA_WEIGHT'}
Setting default data_group_out  to  {'data': 'DATA_ROT', 'flag': 'FLAG', 'id': '3', 'uvw': 'UVW_ROT', 'weight': 'DATA_WEIGHT', 'imaging_weight': 'DATA_WEIGHT'}
Setting default chan_tolerance_factor  to  0.005
Setting default oversampling  to  [10, 10]
Setting default max_support  to  [15, 15]
Setting default support_cut_level  to  0.025
Setting default a_chan_num_chunk  to  3
Setting default image_center  to  [500 360]
#########################  Created graph for make_gridding_convolution_function #########################
Time to store and execute graph  write_zarr 7.4372382164001465
[8]:
<xarray.Dataset>
Dimensions:             (baseline: 903, chan: 3, conv_baseline: 1, conv_chan: 3, conv_pol: 1, field_id: 3, l: 1000, m: 720, pol: 1, u: 160, v: 160, xy: 2)
Coordinates:
  * field_id            (field_id) int64 0 1 2
  * l                   (l) int64 0 1 2 3 4 5 6 ... 993 994 995 996 997 998 999
  * m                   (m) int64 0 1 2 3 4 5 6 ... 713 714 715 716 717 718 719
  * u                   (u) int64 0 1 2 3 4 5 6 ... 153 154 155 156 157 158 159
  * v                   (v) int64 0 1 2 3 4 5 6 ... 153 154 155 156 157 158 159
  * xy                  (xy) int64 0 1
Dimensions without coordinates: baseline, chan, conv_baseline, conv_chan, conv_pol, pol
Data variables:
    CF_BASELINE_MAP     (baseline) int64 dask.array<chunksize=(903,), meta=np.ndarray>
    CF_CHAN_MAP         (chan) int64 dask.array<chunksize=(1,), meta=np.ndarray>
    CF_POL_MAP          (pol) int64 dask.array<chunksize=(1,), meta=np.ndarray>
    CONV_KERNEL         (conv_baseline, conv_chan, conv_pol, u, v) float64 dask.array<chunksize=(1, 1, 1, 160, 160), meta=np.ndarray>
    PHASE_GRADIENT      (field_id, u, v) complex128 dask.array<chunksize=(1, 160, 160), meta=np.ndarray>
    PS_CORR_IMAGE       (l, m) float64 dask.array<chunksize=(1000, 720), meta=np.ndarray>
    SUPPORT             (conv_baseline, conv_chan, conv_pol, xy) int64 dask.array<chunksize=(1, 1, 1, 2), meta=np.ndarray>
    WEIGHT_CONV_KERNEL  (conv_baseline, conv_chan, conv_pol, u, v) float64 dask.array<chunksize=(1, 1, 1, 160, 160), meta=np.ndarray>
Attributes:
    cell_uv:          [-515.6620156177408, 716.197243913529]
    oversampling:     [10, 10]
write_zarr_time: 7.4372382164001465- baseline: 903
- chan: 3
- conv_baseline: 1
- conv_chan: 3
- conv_pol: 1
- field_id: 3
- l: 1000
- m: 720
- pol: 1
- u: 160
- v: 160
- xy: 2
- field_id(field_id)int640 1 2
array([0, 1, 2])
- l(l)int640 1 2 3 4 5 ... 995 996 997 998 999
array([ 0, 1, 2, ..., 997, 998, 999])
- m(m)int640 1 2 3 4 5 ... 715 716 717 718 719
array([ 0, 1, 2, ..., 717, 718, 719])
- u(u)int640 1 2 3 4 5 ... 155 156 157 158 159
array([ 0, 1, 2, 3, 4, 5, 6, 7, 8, 9, 10, 11, 12, 13, 14, 15, 16, 17, 18, 19, 20, 21, 22, 23, 24, 25, 26, 27, 28, 29, 30, 31, 32, 33, 34, 35, 36, 37, 38, 39, 40, 41, 42, 43, 44, 45, 46, 47, 48, 49, 50, 51, 52, 53, 54, 55, 56, 57, 58, 59, 60, 61, 62, 63, 64, 65, 66, 67, 68, 69, 70, 71, 72, 73, 74, 75, 76, 77, 78, 79, 80, 81, 82, 83, 84, 85, 86, 87, 88, 89, 90, 91, 92, 93, 94, 95, 96, 97, 98, 99, 100, 101, 102, 103, 104, 105, 106, 107, 108, 109, 110, 111, 112, 113, 114, 115, 116, 117, 118, 119, 120, 121, 122, 123, 124, 125, 126, 127, 128, 129, 130, 131, 132, 133, 134, 135, 136, 137, 138, 139, 140, 141, 142, 143, 144, 145, 146, 147, 148, 149, 150, 151, 152, 153, 154, 155, 156, 157, 158, 159]) - v(v)int640 1 2 3 4 5 ... 155 156 157 158 159
array([ 0, 1, 2, 3, 4, 5, 6, 7, 8, 9, 10, 11, 12, 13, 14, 15, 16, 17, 18, 19, 20, 21, 22, 23, 24, 25, 26, 27, 28, 29, 30, 31, 32, 33, 34, 35, 36, 37, 38, 39, 40, 41, 42, 43, 44, 45, 46, 47, 48, 49, 50, 51, 52, 53, 54, 55, 56, 57, 58, 59, 60, 61, 62, 63, 64, 65, 66, 67, 68, 69, 70, 71, 72, 73, 74, 75, 76, 77, 78, 79, 80, 81, 82, 83, 84, 85, 86, 87, 88, 89, 90, 91, 92, 93, 94, 95, 96, 97, 98, 99, 100, 101, 102, 103, 104, 105, 106, 107, 108, 109, 110, 111, 112, 113, 114, 115, 116, 117, 118, 119, 120, 121, 122, 123, 124, 125, 126, 127, 128, 129, 130, 131, 132, 133, 134, 135, 136, 137, 138, 139, 140, 141, 142, 143, 144, 145, 146, 147, 148, 149, 150, 151, 152, 153, 154, 155, 156, 157, 158, 159]) - xy(xy)int640 1
array([0, 1])
- CF_BASELINE_MAP(baseline)int64dask.array<chunksize=(903,), meta=np.ndarray>
Array Chunk Bytes 7.05 kiB 7.05 kiB Shape (903,) (903,) Count 2 Tasks 1 Chunks Type int64 numpy.ndarray - CF_CHAN_MAP(chan)int64dask.array<chunksize=(1,), meta=np.ndarray>
Array Chunk Bytes 24 B 8 B Shape (3,) (1,) Count 4 Tasks 3 Chunks Type int64 numpy.ndarray - CF_POL_MAP(pol)int64dask.array<chunksize=(1,), meta=np.ndarray>
Array Chunk Bytes 8 B 8 B Shape (1,) (1,) Count 2 Tasks 1 Chunks Type int64 numpy.ndarray - CONV_KERNEL(conv_baseline, conv_chan, conv_pol, u, v)float64dask.array<chunksize=(1, 1, 1, 160, 160), meta=np.ndarray>
Array Chunk Bytes 600.00 kiB 200.00 kiB Shape (1, 3, 1, 160, 160) (1, 1, 1, 160, 160) Count 4 Tasks 3 Chunks Type float64 numpy.ndarray - PHASE_GRADIENT(field_id, u, v)complex128dask.array<chunksize=(1, 160, 160), meta=np.ndarray>
Array Chunk Bytes 1.17 MiB 400.00 kiB Shape (3, 160, 160) (1, 160, 160) Count 4 Tasks 3 Chunks Type complex128 numpy.ndarray - PS_CORR_IMAGE(l, m)float64dask.array<chunksize=(1000, 720), meta=np.ndarray>
Array Chunk Bytes 5.49 MiB 5.49 MiB Shape (1000, 720) (1000, 720) Count 2 Tasks 1 Chunks Type float64 numpy.ndarray - SUPPORT(conv_baseline, conv_chan, conv_pol, xy)int64dask.array<chunksize=(1, 1, 1, 2), meta=np.ndarray>
Array Chunk Bytes 48 B 16 B Shape (1, 3, 1, 2) (1, 1, 1, 2) Count 4 Tasks 3 Chunks Type int64 numpy.ndarray - WEIGHT_CONV_KERNEL(conv_baseline, conv_chan, conv_pol, u, v)float64dask.array<chunksize=(1, 1, 1, 160, 160), meta=np.ndarray>
Array Chunk Bytes 600.00 kiB 200.00 kiB Shape (1, 3, 1, 160, 160) (1, 1, 1, 160, 160) Count 4 Tasks 3 Chunks Type float64 numpy.ndarray
- cell_uv :
- [-515.6620156177408, 716.197243913529]
- oversampling :
- [10, 10]
- write_zarr_time :
- 7.4372382164001465
Make Mosaic Primary Beam, PSF, and Image
[9]:
from ngcasa.imaging import make_mosaic_pb
from cngi.dio import read_image

vis_sel_parms = {}
vis_sel_parms['xds'] = 'xds0'
vis_sel_parms['data_group_in_id'] = 2

img_sel_parms = {}
img_xds= xr.Dataset()

img_xds = make_mosaic_pb(mxds,gcf_xds,img_xds,vis_sel_parms,img_sel_parms,grid_parms)

###############################################

from ngcasa.imaging import make_psf

vis_sel_parms = {}
vis_sel_parms['xds'] = 'xds0'
vis_sel_parms['data_group_in_id'] = 2

img_sel_parms = {}
img_sel_parms['data_group_out_id'] = 0

img_xds = make_psf(mxds, img_xds, grid_parms, vis_sel_parms, img_sel_parms)

##############################################

from ngcasa.imaging import make_image_with_gcf
from cngi.dio import write_image

vis_select_parms = {}
vis_select_parms['xds'] = 'xds0'
vis_select_parms['data_group_in_id'] = 2

img_select_parms = {}
img_select_parms['data_group_in_id'] = 0
img_select_parms['data_group_out_id'] = 0

norm_parms = {}
norm_parms['norm_type'] = 'flat_sky'

img_xds = make_image_with_gcf(mxds,gcf_xds, img_xds, grid_parms, norm_parms, vis_select_parms, img_select_parms)
write_image(img_xds,'mosaic_img.img.zarr')
img_xds = read_image('mosaic_img.img.zarr')
img_xds
######################### Start make_mosaic_pb #########################
Setting default image_center  to  [500 360]
Setting data_group_in  to  {'data': 'DATA_ROT', 'flag': 'FLAG', 'id': '2', 'uvw': 'UVW_ROT', 'weight': 'DATA_WEIGHT', 'imaging_weight': 'DATA_WEIGHT'}
Setting default data_group_out  to  {'data': 'DATA_ROT', 'flag': 'FLAG', 'id': '3', 'uvw': 'UVW_ROT', 'weight': 'DATA_WEIGHT', 'imaging_weight': 'DATA_WEIGHT'}
Setting default data_group_in  to  {'id': '0'}
Setting default data_group_out  to  {'id': '0', 'pb': 'PB', 'weight_pb': 'WEIGHT_PB', 'weight_pb_sum_weight': 'WEIGHT_PB_SUM_WEIGHT'}
#########################  Created graph for make_mosaic_pb #########################
######################### Start make_psf #########################
Setting default image_center  to  [500 360]
Setting data_group_in  to  {'data': 'DATA_ROT', 'flag': 'FLAG', 'id': '2', 'uvw': 'UVW_ROT', 'weight': 'DATA_WEIGHT', 'imaging_weight': 'DATA_WEIGHT'}
Setting default data_group_out  to  {'data': 'DATA_ROT', 'flag': 'FLAG', 'id': '3', 'uvw': 'UVW_ROT', 'weight': 'DATA_WEIGHT', 'imaging_weight': 'DATA_WEIGHT'}
Setting default data_group_in  to  {'id': '0', 'pb': 'PB', 'weight_pb': 'WEIGHT_PB', 'weight_pb_sum_weight': 'WEIGHT_PB_SUM_WEIGHT'}
Setting default data_group_out [' pb ']  to  PB
Setting default data_group_out [' weight_pb ']  to  WEIGHT_PB
Setting default data_group_out [' weight_pb_sum_weight ']  to  WEIGHT_PB_SUM_WEIGHT
Setting default data_group_out [' sum_weight ']  to  PSF_SUM_WEIGHT
Setting default data_group_out [' psf ']  to  PSF
Setting default data_group_out [' psf_fit ']  to  PSF_FIT
######################### Created graph for make_psf #########################
######################### Start make_image_with_gcf #########################
Setting default image_center  to  [500 360]
Setting default single_precision  to  True
Setting default pb_limit  to  0.2
Setting data_group_in  to  {'data': 'DATA_ROT', 'flag': 'FLAG', 'id': '2', 'uvw': 'UVW_ROT', 'weight': 'DATA_WEIGHT', 'imaging_weight': 'DATA_WEIGHT'}
Setting default data_group_out  to  {'data': 'DATA_ROT', 'flag': 'FLAG', 'id': '3', 'uvw': 'UVW_ROT', 'weight': 'DATA_WEIGHT', 'imaging_weight': 'DATA_WEIGHT'}
Setting data_group_in  to  {'id': '0', 'pb': 'PB', 'weight_pb': 'WEIGHT_PB', 'weight_pb_sum_weight': 'WEIGHT_PB_SUM_WEIGHT', 'sum_weight': 'PSF_SUM_WEIGHT', 'psf': 'PSF', 'psf_fit': 'PSF_FIT'}
Setting default data_group_out [' pb ']  to  PB
Setting default data_group_out [' weight_pb ']  to  WEIGHT_PB
Setting default data_group_out [' weight_pb_sum_weight ']  to  WEIGHT_PB_SUM_WEIGHT
Setting default data_group_out [' sum_weight ']  to  SUM_WEIGHT
Setting default data_group_out [' psf ']  to  PSF
Setting default data_group_out [' psf_fit ']  to  PSF_FIT
Setting default data_group_out [' image ']  to  IMAGE
grid sizes 1000 720
#########################  Created graph for make_mosaic_with_gcf #########################
Time to store and execute graph  write_zarr 10.509612560272217
[9]:
<xarray.Dataset>
Dimensions:               (chan: 3, elps_index: 3, l: 1000, m: 720, pol: 1, time: 1)
Coordinates:
  * chan                  (chan) float64 3.4e+11 3.74e+11 4.08e+11
    chan_width            (chan) float64 dask.array<chunksize=(1,), meta=np.ndarray>
    declination           (l, m) float64 dask.array<chunksize=(250, 180), meta=np.ndarray>
  * l                     (l) float64 9.696e-05 9.677e-05 ... -9.677e-05
  * m                     (m) float64 -6.981e-05 -6.962e-05 ... 6.962e-05
  * pol                   (pol) int32 9
    right_ascension       (l, m) float64 dask.array<chunksize=(250, 180), meta=np.ndarray>
  * time                  (time) datetime64[ns] 2011-05-27T20:27:14.772603989
Dimensions without coordinates: elps_index
Data variables:
    IMAGE                 (l, m, time, chan, pol) float64 dask.array<chunksize=(1000, 720, 1, 1, 1), meta=np.ndarray>
    PB                    (l, m, time, chan, pol) float64 dask.array<chunksize=(1000, 720, 1, 1, 1), meta=np.ndarray>
    PSF                   (l, m, time, chan, pol) float64 dask.array<chunksize=(1000, 720, 1, 1, 1), meta=np.ndarray>
    PSF_FIT               (time, chan, pol, elps_index) float64 dask.array<chunksize=(1, 1, 1, 3), meta=np.ndarray>
    PSF_SUM_WEIGHT        (time, chan, pol) float64 dask.array<chunksize=(1, 1, 1), meta=np.ndarray>
    SUM_WEIGHT            (time, chan, pol) float64 dask.array<chunksize=(1, 1, 1), meta=np.ndarray>
    WEIGHT_PB             (l, m, time, chan, pol) float64 dask.array<chunksize=(1000, 720, 1, 1, 1), meta=np.ndarray>
    WEIGHT_PB_SUM_WEIGHT  (time, chan, pol) float64 dask.array<chunksize=(1, 1, 1), meta=np.ndarray>
Attributes:
    axis_units:           ['rad', 'rad', 'time', 'Hz', 'pol']
    data_groups:          [{'0': {'id': '0', 'image': 'IMAGE', 'pb': 'PB', 'p...
    direction_reference:  FK5
    spectral_reference:   lsrk
    unit:                 Jy/beam
    velocity_type:        radio
write_zarr_time: 10.509612560272217- chan: 3
- elps_index: 3
- l: 1000
- m: 720
- pol: 1
- time: 1
- chan(chan)float643.4e+11 3.74e+11 4.08e+11
array([3.40e+11, 3.74e+11, 4.08e+11])
- chan_width(chan)float64dask.array<chunksize=(1,), meta=np.ndarray>
Array Chunk Bytes 24 B 8 B Shape (3,) (1,) Count 4 Tasks 3 Chunks Type float64 numpy.ndarray - declination(l, m)float64dask.array<chunksize=(250, 180), meta=np.ndarray>
Array Chunk Bytes 5.49 MiB 351.56 kiB Shape (1000, 720) (250, 180) Count 17 Tasks 16 Chunks Type float64 numpy.ndarray - l(l)float649.696e-05 9.677e-05 ... -9.677e-05
array([ 9.696274e-05, 9.676881e-05, 9.657489e-05, ..., -9.638096e-05, -9.657489e-05, -9.676881e-05]) - m(m)float64-6.981e-05 -6.962e-05 ... 6.962e-05
array([-6.981317e-05, -6.961924e-05, -6.942532e-05, ..., 6.923139e-05, 6.942532e-05, 6.961924e-05]) - pol(pol)int329
array([9], dtype=int32)
- right_ascension(l, m)float64dask.array<chunksize=(250, 180), meta=np.ndarray>
Array Chunk Bytes 5.49 MiB 351.56 kiB Shape (1000, 720) (250, 180) Count 17 Tasks 16 Chunks Type float64 numpy.ndarray - time(time)datetime64[ns]2011-05-27T20:27:14.772603989
array(['2011-05-27T20:27:14.772603989'], dtype='datetime64[ns]')
- IMAGE(l, m, time, chan, pol)float64dask.array<chunksize=(1000, 720, 1, 1, 1), meta=np.ndarray>
Array Chunk Bytes 16.48 MiB 5.49 MiB Shape (1000, 720, 1, 3, 1) (1000, 720, 1, 1, 1) Count 4 Tasks 3 Chunks Type float64 numpy.ndarray - PB(l, m, time, chan, pol)float64dask.array<chunksize=(1000, 720, 1, 1, 1), meta=np.ndarray>
Array Chunk Bytes 16.48 MiB 5.49 MiB Shape (1000, 720, 1, 3, 1) (1000, 720, 1, 1, 1) Count 4 Tasks 3 Chunks Type float64 numpy.ndarray - PSF(l, m, time, chan, pol)float64dask.array<chunksize=(1000, 720, 1, 1, 1), meta=np.ndarray>
Array Chunk Bytes 16.48 MiB 5.49 MiB Shape (1000, 720, 1, 3, 1) (1000, 720, 1, 1, 1) Count 4 Tasks 3 Chunks Type float64 numpy.ndarray - PSF_FIT(time, chan, pol, elps_index)float64dask.array<chunksize=(1, 1, 1, 3), meta=np.ndarray>
Array Chunk Bytes 72 B 24 B Shape (1, 3, 1, 3) (1, 1, 1, 3) Count 4 Tasks 3 Chunks Type float64 numpy.ndarray - PSF_SUM_WEIGHT(time, chan, pol)float64dask.array<chunksize=(1, 1, 1), meta=np.ndarray>
Array Chunk Bytes 24 B 8 B Shape (1, 3, 1) (1, 1, 1) Count 4 Tasks 3 Chunks Type float64 numpy.ndarray - SUM_WEIGHT(time, chan, pol)float64dask.array<chunksize=(1, 1, 1), meta=np.ndarray>
Array Chunk Bytes 24 B 8 B Shape (1, 3, 1) (1, 1, 1) Count 4 Tasks 3 Chunks Type float64 numpy.ndarray - WEIGHT_PB(l, m, time, chan, pol)float64dask.array<chunksize=(1000, 720, 1, 1, 1), meta=np.ndarray>
Array Chunk Bytes 16.48 MiB 5.49 MiB Shape (1000, 720, 1, 3, 1) (1000, 720, 1, 1, 1) Count 4 Tasks 3 Chunks Type float64 numpy.ndarray - WEIGHT_PB_SUM_WEIGHT(time, chan, pol)float64dask.array<chunksize=(1, 1, 1), meta=np.ndarray>
Array Chunk Bytes 24 B 8 B Shape (1, 3, 1) (1, 1, 1) Count 4 Tasks 3 Chunks Type float64 numpy.ndarray
- axis_units :
- ['rad', 'rad', 'time', 'Hz', 'pol']
- data_groups :
- [{'0': {'id': '0', 'image': 'IMAGE', 'pb': 'PB', 'psf': 'PSF', 'psf_fit': 'PSF_FIT', 'sum_weight': 'SUM_WEIGHT', 'weight_pb': 'WEIGHT_PB', 'weight_pb_sum_weight': 'WEIGHT_PB_SUM_WEIGHT'}}]
- direction_reference :
- FK5
- spectral_reference :
- lsrk
- unit :
- Jy/beam
- velocity_type :
- radio
- write_zarr_time :
- 10.509612560272217
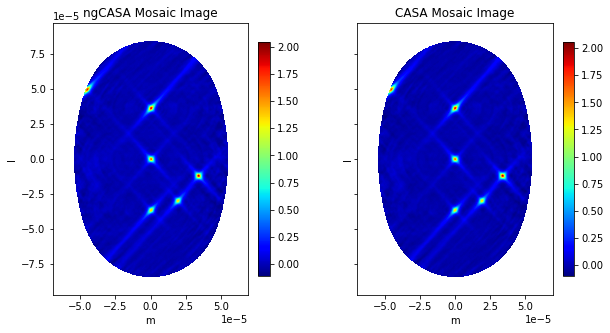
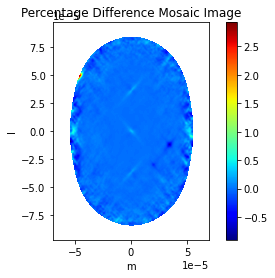
Compare CASA and ngCASA Primary Beams
[10]:
import matplotlib.pylab as plt
import numpy as np
from ipywidgets import interactive
import scipy
from scipy.signal import decimate
from cngi.image import implot

img_xds = read_image('mosaic_img.img.zarr').isel(time=0,pol=0)
casa_img_xds = read_image('alma12m_3field_dovpTrue_gridder_mosaic.img.zarr').isel(time=0,pol=0)
pb_limit = 0.2
extent = extent=(np.min(casa_img_xds.m),np.max(casa_img_xds.m),np.min(casa_img_xds.l),np.max(casa_img_xds.l))

def comparison_plots(chan):
    plt.close('all')
    print('Frequency',img_xds.chan[chan].values/10**9, 'GHz')
    mosaic_pb = img_xds.PB.isel(chan=chan)
    mosaic_pb = mosaic_pb.where(mosaic_pb > pb_limit,other=np.nan)

    casa_mosaic_pb = casa_img_xds.PB.isel(chan=chan)
    casa_mosaic_pb = casa_mosaic_pb.where(casa_mosaic_pb > pb_limit,other=np.nan)

    fig0, ax0 = plt.subplots(1, 2, sharey=True,figsize=(10, 5))
    im0 = ax0[0].imshow(mosaic_pb,extent=extent,cmap='jet')
    im1 = ax0[1].imshow(casa_mosaic_pb,extent=extent,cmap='jet')
    ax0[0].title.set_text('ngCASA Mosaic PB')
    ax0[1].title.set_text('CASA Mosaic PB')
    ax0[0].set_xlabel('m'), ax0[1].set_xlabel('m'), ax0[0].set_ylabel('l'), ax0[1].set_ylabel('l')
    fig0.colorbar(im0, ax=ax0[0], fraction=0.046, pad=0.04)
    fig0.colorbar(im1, ax=ax0[1], fraction=0.046, pad=0.04)

    plt.figure()
    plt.plot(casa_mosaic_pb.l,mosaic_pb.isel(m=360),label='ngCASA PB')
    plt.plot(casa_mosaic_pb.l,casa_mosaic_pb.isel(m=360),'*',label='CASA PB',markersize=1)
    plt.legend()
    plt.xlabel('l')
    plt.ylabel('Amplitude')
    plt.title('Mosaic PB Cross Section')

    diff_image = mosaic_pb - casa_mosaic_pb

    plt.figure()
    plt.imshow(100*(mosaic_pb - casa_mosaic_pb),extent=extent,cmap='jet')
    plt.xlabel('m'), plt.ylabel('l')
    plt.colorbar()
    plt.title('Percentage Difference Mosaic PB')

    plt.show()

interactive_plot = interactive(comparison_plots, chan=(0, 2))
output = interactive_plot.children[-1]
output.layout.auto_scroll_threshold = 9999;
#interactive_plot
comparison_plots(1)
Frequency 374.0 GHz
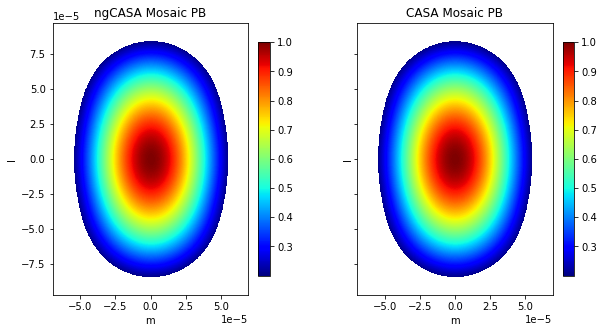
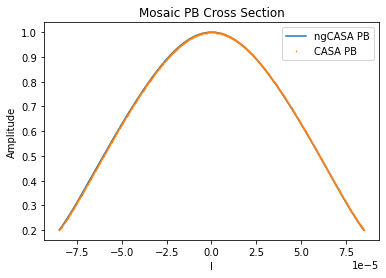
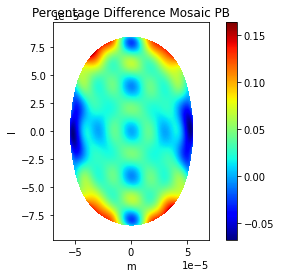
Get Simulated Sources l,m Coordinates
[11]:
from astropy.coordinates import SkyCoord
from astropy.wcs import WCS
rad_to_deg =  180/np.pi
deg_to_rad = np.pi/180
arcsec_to_deg = 1/3600
arcsec_to_rad = np.pi/(180*3600)

phase_center = grid_parms['phase_center']
w = WCS(naxis=2)
w.wcs.crpix = np.array(grid_parms['image_size'])//2
w.wcs.cdelt = np.array([-0.04,0.04])*arcsec_to_deg
w.wcs.crval = phase_center*rad_to_deg
w.wcs.ctype = ['RA---SIN','DEC--SIN']

ra = ['12h01m51.903005s','12h01m52.430856s','12h01m52.958707s','12h01m52.259s','12h01m52s','12h01m53.153s']
dec = ['-18d51m49.94373s','-18d51m49.94369s','-18d51m49.94365s','-18d51m42.983s','-18d51m46s','-18d51m59.305s']
ps_skycoord = SkyCoord(ra=ra,dec=dec,frame='fk5')


ra_dec = np.array([ps_skycoord.ra.degree,ps_skycoord.dec.degree]).T
lm_pix_pos = w.all_world2pix(ra_dec, 1)

cell_size = np.array(grid_parms['cell_size'])*arcsec_to_rad
cell_size[0] = -cell_size[0]
image_center = np.array(grid_parms['image_size'])//2
source_lm_pos = lm_pix_pos*cell_size - image_center*cell_size
Compare CASA and ngCASA Sky Images
[12]:
import matplotlib.pylab as plt
import numpy as np
from ipywidgets import interactive
import scipy
from scipy.signal import decimate

img_xds = read_image('mosaic_img.img.zarr',chunks={'l':grid_parms['image_size'][0],'m':grid_parms['image_size'][1]}).isel(time=0,pol=0)
casa_img_xds = read_image('alma12m_3field_dovpTrue_gridder_mosaic.img.zarr',chunks={'l':grid_parms['image_size'][0],'m':grid_parms['image_size'][1]}).isel(time=0,pol=0)
pb_limit = 0.2
extent = extent=(np.min(casa_img_xds.m),np.max(casa_img_xds.m),np.min(casa_img_xds.l),np.max(casa_img_xds.l))

ngcasa_image_name = 'IMAGE'
casa_image_name = 'IMAGE_PBCOR'

def comparison_plots(chan):
    print('Frequency',img_xds.chan[chan].values/10**9, 'GHz')
    mosaic_pb = img_xds.PB.isel(chan=chan)
    casa_mosaic_pb = casa_img_xds.PB.isel(chan=chan)

    mosaic_img = img_xds[ngcasa_image_name].isel(chan=chan)
    mosaic_img = mosaic_img.where(mosaic_pb > pb_limit,other=np.nan)

    casa_mosaic_img = casa_img_xds[casa_image_name].isel(chan=chan)
    casa_mosaic_img = casa_mosaic_img.where(casa_mosaic_pb > pb_limit,other=np.nan)

    sim_sources = np.array([1.5,1.76,2.0,2.0,1.456,1.888])

    print('################## Flux of Point Sources ##################')
    print('Sim    ','ngCASA  ', 'CASA')
    for i,s in enumerate(sim_sources):
        ngcasa_recovered_val = img_xds[ngcasa_image_name].isel(chan=chan).interp(l=source_lm_pos[i,0],m=source_lm_pos[i,1]).values
        casa_recovered_val = casa_mosaic_img.interp(l=source_lm_pos[i,0],m=source_lm_pos[i,1]).values
        print('{0:.3f}  '.format(s),'{0:.4f}  '.format(ngcasa_recovered_val),'{0:.4f}'.format(casa_recovered_val))


    print('############ Percentage Difference Flux to Sim ############')
    print('ngCASA  ', 'CASA')
    for i,s in enumerate(sim_sources):
        ngcasa_recovered_val = img_xds[ngcasa_image_name].isel(chan=chan).interp(l=source_lm_pos[i,0],m=source_lm_pos[i,1]).values
        casa_recovered_val = casa_mosaic_img.interp(l=source_lm_pos[i,0],m=source_lm_pos[i,1]).values
        print('{0:.4f}  '.format(100*(s-ngcasa_recovered_val)/s),'{0:.4f}'.format(100*(s-casa_recovered_val)/s))

    fig0, ax0 = plt.subplots(1, 2, sharey=True,figsize=(10, 5))
    im0 = ax0[0].imshow(mosaic_img,cmap='jet',extent=extent)
    im1 = ax0[1].imshow(casa_mosaic_img,cmap='jet',extent=extent)
    ax0[0].set_xlabel('m'), ax0[1].set_xlabel('m'), ax0[0].set_ylabel('l'), ax0[1].set_ylabel('l')
    ax0[0].title.set_text('ngCASA Mosaic Image')
    ax0[1].title.set_text('CASA Mosaic Image')
    fig0.colorbar(im0, ax=ax0[0], fraction=0.046, pad=0.04)
    fig0.colorbar(im1, ax=ax0[1], fraction=0.046, pad=0.04)

    plt.figure()
    plt.imshow((100*(mosaic_img - casa_mosaic_img)/2),cmap='jet',extent=extent)
    plt.colorbar()
    plt.xlabel('m'), plt.ylabel('l')
    plt.title('Percentage Difference Mosaic Image')

    plt.show()

interactive_plot = interactive(comparison_plots, chan=(0, 2))
output = interactive_plot.children[-1]
output.layout.height = '1450px'
#interactive_plot
comparison_plots(1)
Frequency 374.0 GHz
################## Flux of Point Sources ##################
Sim     ngCASA   CASA
1.500   1.4935   1.4909
1.760   1.7518   1.7458
2.000   1.9950   1.9913
2.000   2.0391   2.0546
1.456   1.4630   1.4686
1.888   1.8954   1.8425
############ Percentage Difference Flux to Sim ############
ngCASA   CASA
0.4325   0.6079
0.4672   0.8043
0.2492   0.4330
-1.9533   -2.7304
-0.4825   -0.8683
-0.3894   2.4083